23 type(display_type) :: disp
24 integer(IK) :: nsam, shift, itry, ntry
= 1
25 character(:),
allocatable :: format
29 call disp%show(
"!%%%%%%%%%%%%%%%%%%%%%%%%%%%%%%%%%%%%%%%%%%%%%")
30 call disp%show(
"!Compute the cross-correlation of two samples.")
31 call disp%show(
"!%%%%%%%%%%%%%%%%%%%%%%%%%%%%%%%%%%%%%%%%%%%%%")
36 integer(IK),
allocatable :: lag(:)
37 real(TKG),
allocatable :: f(:), g(:)
38 real(TKG),
allocatable ::
range(:), acf(:)
40 call disp%show(
"nsam = 41; shift = nsam")
41 nsam
= 41; shift
= nsam
42 call disp%show(
"range = getLinSpace(-10., 10., nsam)")
56 call disp%show(
"acf = getCCF(f, g, lag = getRange(1 - nsam, nsam - 1_IK)) ! same as above.")
62 call disp%show(
"acf = getCCF(f, g, lag = getRange(0_IK, nsam - 1_IK)) ! same as above.")
68 call disp%show(
"lag = getRange(-nsam + 1_IK, nsam - 1_IK)")
69 lag
= getRange(
-nsam
+ 1_IK, nsam
- 1_IK)
70 call disp%show(
"acf = getACF(f, lag)")
76 call disp%show(
"if (0 /= getErrTableWrite(SK_'getACF.crd.sin.RK.txt', reshape([range, f], [nsam, 2_IK]), header = SK_'crd,f')) error stop 'acf outputting failed.'")
77 if (
0 /= getErrTableWrite(SK_
'getACF.crd.sin.RK.txt',
reshape([range, f], [nsam,
2_IK]), header
= SK_
'crd,f'))
error stop 'acf outputting failed.'
78 call disp%show(
"if (0 /= getErrTableWrite(SK_'getACF.acf.sin.RK.txt', reshape([real(lag, TKG), acf], [size(lag), 2]), header = SK_'lag,acf')) error stop 'acf outputting failed.'")
79 if (
0 /= getErrTableWrite(SK_
'getACF.acf.sin.RK.txt',
reshape([
real(lag, TKG), acf], [
size(lag),
2]), header
= SK_
'lag,acf'))
error stop 'acf outputting failed.'
85 integer(IK),
allocatable :: lag(:)
86 complex(TKG),
allocatable :: f(:), g(:), acf(:),
range(:)
88 call disp%show(
"nsam = 41; shift = nsam")
89 nsam
= 41; shift
= nsam
90 call disp%show(
"range = getLinSpace((-10._TKG, +10._TKG), (+10._TKG, -10._TKG), nsam)")
91 range
= getLinSpace((
-10._TKG,
+10._TKG), (
+10._TKG,
-10._TKG), nsam)
106 call disp%show(
"acf = getCCF(f, g, lag = getRange(0_IK, nsam - 1_IK)) ! same as above.")
114 call disp%show(
"lag = getRange(-nsam + 1_IK, nsam - 1_IK)")
115 lag
= getRange(
-nsam
+ 1_IK, nsam
- 1_IK)
116 call disp%show(
"acf = getACF(f, lag)")
Generate and return an array of the specified rank and shape of arbitrary intrinsic type and kind wit...
Generate a resized copy of the input array by padding it to the right with the requested paddings and...
Generate minimally-spaced character, integer, real sequences or sequences at fixed intervals of size ...
Allocate or resize (shrink or expand) an input allocatable scalar string or array of rank 1....
Generate count evenly spaced points over the interval [x1, x2] if x1 < x2, or [x2,...
Generate the natural logarithm of probability density function (PDF) of the univariate Normal distrib...
Generate and return a scalar or a contiguous array of rank 1 of length s1 of randomly uniformly distr...
Generate and return the iostat code resulting from writing the input table of rank 1 or 2 to the spec...
This is a generic method of the derived type display_type with pass attribute.
This is a generic method of the derived type display_type with pass attribute.
Generate and return the cross-correlation function (CCF) of the discrete signal lagging the signal ...
Generate and return the (weighted) mean of an input sample of nsam observations with ndim = 1 or 2 at...
Generate a sample of shape (nsam), or (ndim, nsam) or (nsam, ndim) that is normalized by the specifie...
Generate a sample of shape (nsam), or (ndim, nsam) or (nsam, ndim) that is shifted by the specified i...
Generate and return the variance of the input sample of type complex or real of shape (nsam) or (ndim...
This module contains procedures and generic interfaces for convenient allocation and filling of array...
This module contains procedures and generic interfaces for resizing an input array and padding them w...
This module contains procedures and generic interfaces for generating ranges of discrete character,...
This module contains procedures and generic interfaces for resizing allocatable arrays of various typ...
This module contains procedures and generic interfaces for generating arrays with linear or logarithm...
This module contains classes and procedures for computing various statistical quantities related to t...
This module contains classes and procedures for computing various statistical quantities related to t...
This module contains classes and procedures for input/output (IO) or generic display operations on st...
type(display_type) disp
This is a scalar module variable an object of type display_type for general display.
This module defines the relevant Fortran kind type-parameters frequently used in the ParaMonte librar...
integer, parameter RK
The default real kind in the ParaMonte library: real64 in Fortran, c_double in C-Fortran Interoperati...
integer, parameter LK
The default logical kind in the ParaMonte library: kind(.true.) in Fortran, kind(....
integer, parameter IK
The default integer kind in the ParaMonte library: int32 in Fortran, c_int32_t in C-Fortran Interoper...
integer, parameter SK
The default character kind in the ParaMonte library: kind("a") in Fortran, c_char in C-Fortran Intero...
integer, parameter RKS
The single-precision real kind in Fortran mode. On most platforms, this is an 32-bit real kind.
This module contains classes and procedures for computing the first moment (i.e., the statistical mea...
This module contains classes and procedures for normalizing univariate or multivariate samples by arb...
This module contains classes and procedures for shifting univariate or multivariate samples by arbitr...
This module contains classes and procedures for computing the properties related to the covariance ma...
Generate and return an object of type display_type.
3import matplotlib.pyplot
as plt
12for kind
in [
"sin.RK"]:
14 file = glob.glob(
"*crd*"+kind+
".txt")[0]
15 df = pd.read_csv(file, delimiter =
",")
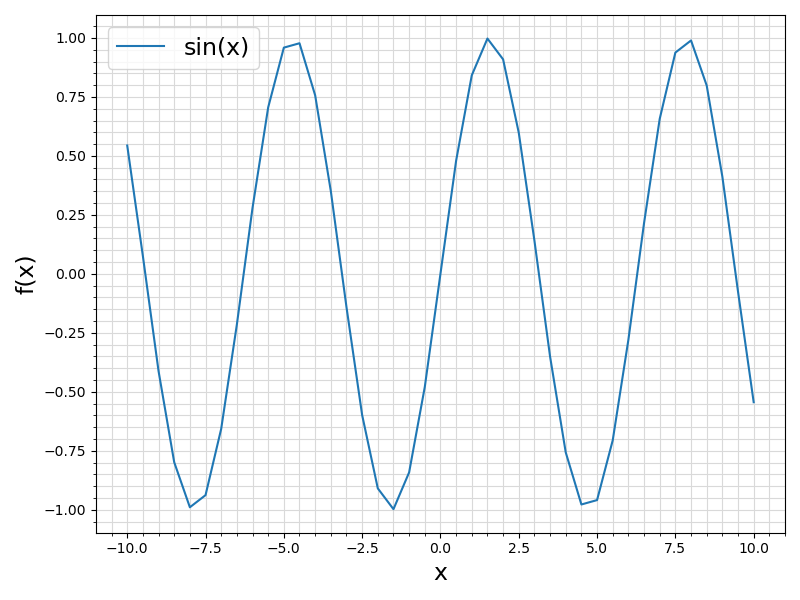
18 fig = plt.figure(figsize = (8, 6))
19 ax = plt.subplot(1,1,1)
20 ax.plot ( df.values[:, 0]
25 ax.set_xlabel(
"x", fontsize = 17)
26 ax.set_ylabel(
"f(x)", fontsize = 17)
27 ax.tick_params(axis =
"x", which =
"minor")
28 ax.tick_params(axis =
"y", which =
"minor")
29 plt.grid(visible =
True, which =
"both", axis =
"both", color =
"0.85", linestyle =
"-")
30 ax.legend([file.split(
".")[-3] +
"(x)"], fontsize = fontsize)
32 plt.savefig(file.replace(
".txt",
".png"))
34 file = glob.glob(
"*acf*"+kind+
".txt")[0]
35 df = pd.read_csv(file, delimiter =
",")
36 fig = plt.figure(figsize = (8, 6))
37 ax = plt.subplot(1,1,1)
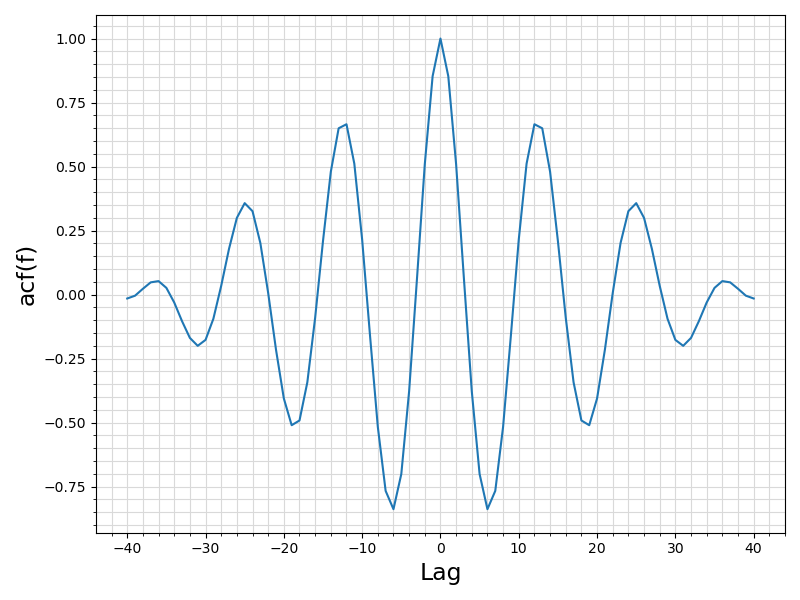
38 ax.plot ( df.values[:, 0]
43 ax.set_xlabel(
"Lag", fontsize = 17)
44 ax.set_ylabel(
"acf(f)", fontsize = 17)
45 ax.tick_params(axis =
"x", which =
"minor")
46 ax.tick_params(axis =
"y", which =
"minor")
47 plt.grid(visible =
True, which =
"both", axis =
"both", color =
"0.85", linestyle =
"-")
49 plt.savefig(file.replace(
".txt",
".png"))


