|
|
ParaMonte MATLAB 3.0.0
Parallel Monte Carlo and Machine Learning Library
See the latest version documentation. |
|
|
ParaMonte MATLAB 3.0.0
Parallel Monte Carlo and Machine Learning Library
See the latest version documentation. |

This is the SubplotEllipse class for generating instances of 2-dimensional Ellipse Subplot visualizations based on the relevant MATLAB intrinsic functions.
More...

Public Member Functions | |
| function | SubplotEllipse (in gramian, in center, in cval, in varargin) |
| Construct and return an object of class pm.vis.SubplotEllipse. More... | |
| function | make (in self, in varargin) |
| Generate a plot from the selected dimensions of the input ellipsoid data to the object constructor. More... | |
This is the SubplotEllipse class for generating instances of 2-dimensional Ellipse Subplot visualizations based on the relevant MATLAB intrinsic functions.
Final Remarks ⛓
If you believe this algorithm or its documentation can be improved, we appreciate your contribution and help to edit this page's documentation and source file on GitHub.
For details on the naming abbreviations, see this page.
For details on the naming conventions, see this page.
This software is distributed under the MIT license with additional terms outlined below.
This software is available to the public under a highly permissive license.
Help us justify its continued development and maintenance by acknowledging its benefit to society, distributing it, and contributing to it.
Definition at line 28 of file SubplotEllipse.m.
| function SubplotEllipse::SubplotEllipse | ( | in | gramian, |
| in | center, | ||
| in | cval, | ||
| in | varargin | ||
| ) |
Construct and return an object of class pm.vis.SubplotEllipse.
In the following documentation,
The variable ndim represents the number of ellipsoids in the input data.
The value of ndim is inferred from the shapes of the input gramian and center arguments as max([2, size(gramian, 1), size(center, 1)]).
The variable nell represents the number of ellipsoids in the input data.
The value of nell is inferred from the shapes of the input gramian, center, and cval arguments as max([size(gramian, 3), size(center, 2), size(cval, 2)]).
If the above expression yields zero, then nell is set to 75.
The variable npnt represents the number of points used in visualizing each ellipsoid.
The value of npnt is inferred from the shapes of the input argument cval as size(cval, 1).
If the above expression yields zero or one, then npnt is set to 100.
zval values for all points of all coordinates are set to default values.| [in] | gramian | : See the corresponding input argument to the constructor of the parent object. |
| [in] | center | : See the corresponding input argument to the constructor of the parent object. |
| [in] | cval | : See the corresponding input argument to the constructor of the parent object. |
| [in] | varargin | : Any property, value pair of the object.If the property is a struct(), then its value must be given as a cell array, with consecutive elements representing the struct property-name, property-value pairs.Note that all of these property-value pairs can be also directly set via the parent object attributes, before calling the make() method. |
self : The output object of class pm.vis.SubplotEllipse.
Possible calling interfaces ⛓
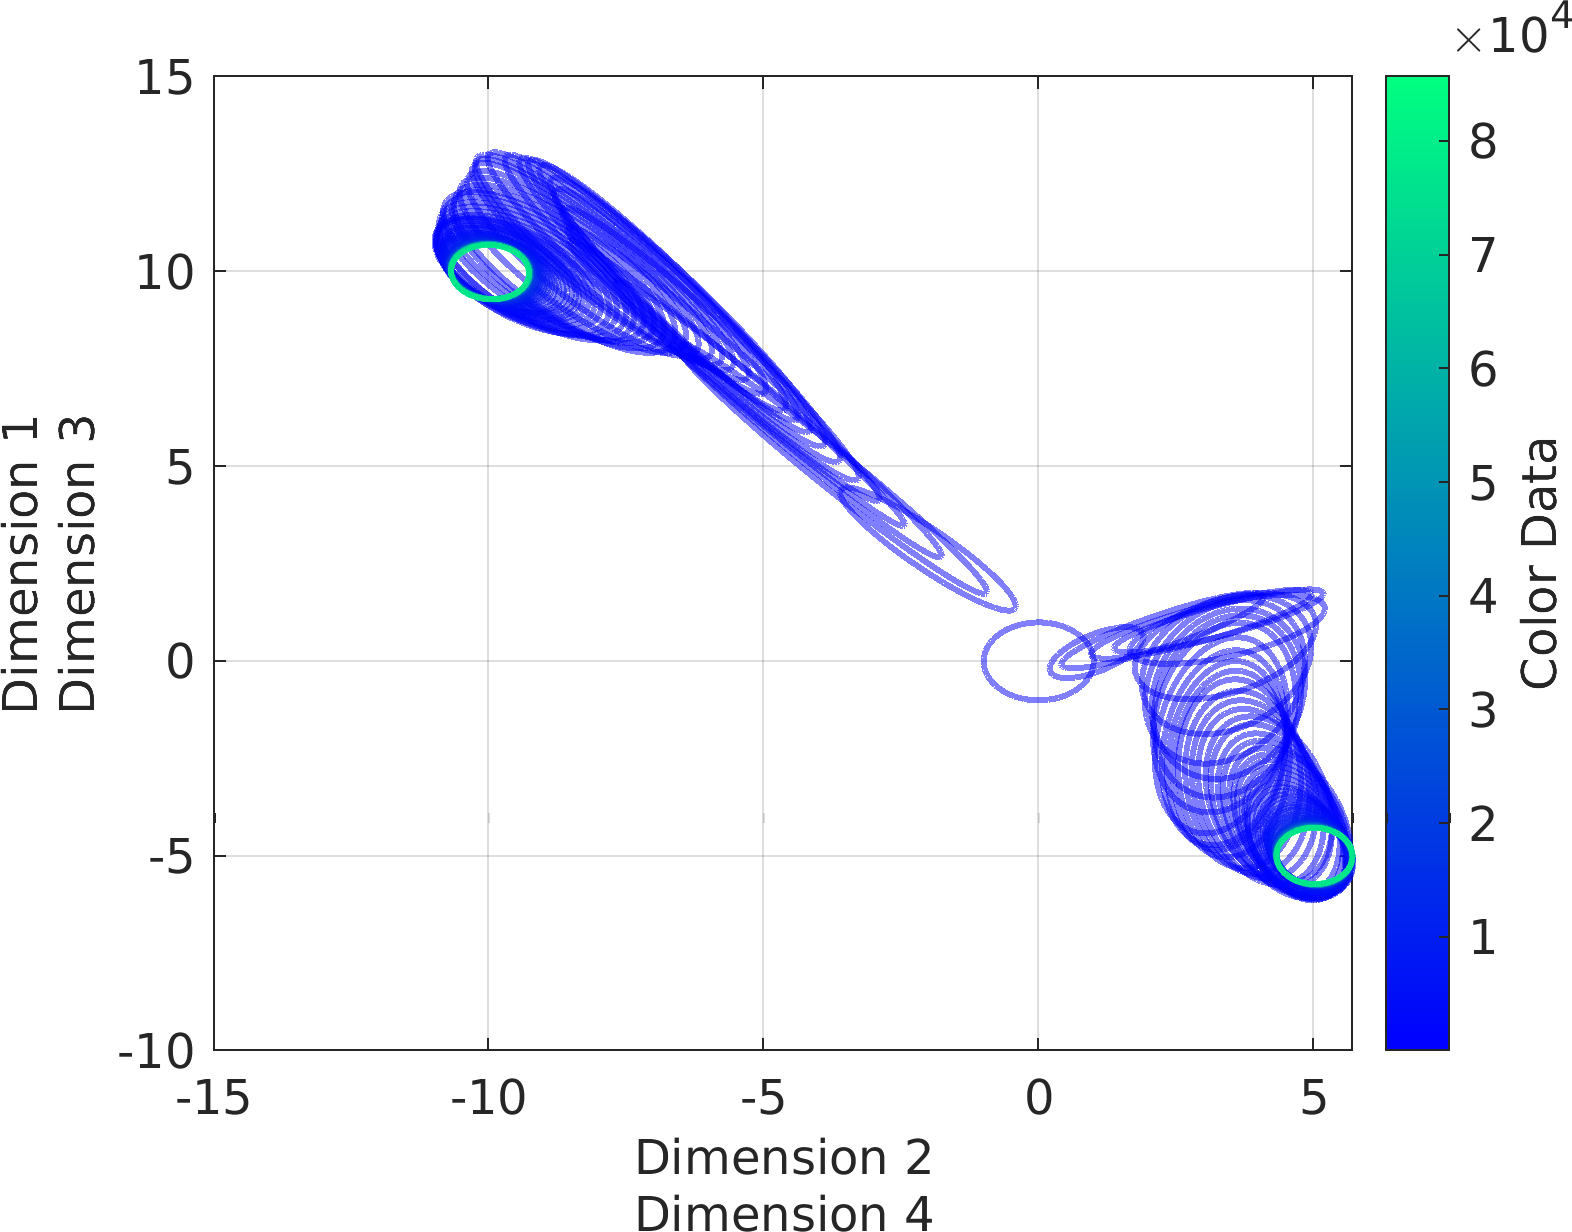
Example usage ⛓
Final Remarks ⛓
If you believe this algorithm or its documentation can be improved, we appreciate your contribution and help to edit this page's documentation and source file on GitHub.
For details on the naming abbreviations, see this page.
For details on the naming conventions, see this page.
This software is distributed under the MIT license with additional terms outlined below.
This software is available to the public under a highly permissive license.
Help us justify its continued development and maintenance by acknowledging its benefit to society, distributing it, and contributing to it.
| function SubplotEllipse::make | ( | in | self, |
| in | varargin | ||
| ) |
Generate a plot from the selected dimensions of the input ellipsoid data to the object constructor.
| [in,out] | self | : The input/output parent object of class pm.vis.SubplotEllipse which is implicitly passed to this dynamic method (not by the user). |
| [in] | varargin | : Any property, value pair of the parent object.If the property is a struct(), then its value must be given as a cell array, with consecutive elements representing the struct property-name, property-value pairs.Note that all of these property-value pairs can be also directly set via the parent object attributes, before calling the make() method. |
Possible calling interfaces ⛓
Example usage ⛓
Final Remarks ⛓
If you believe this algorithm or its documentation can be improved, we appreciate your contribution and help to edit this page's documentation and source file on GitHub.
For details on the naming abbreviations, see this page.
For details on the naming conventions, see this page.
This software is distributed under the MIT license with additional terms outlined below.
This software is available to the public under a highly permissive license.
Help us justify its continued development and maintenance by acknowledging its benefit to society, distributing it, and contributing to it.
fout component.
