|
|
ParaMonte MATLAB 3.0.0
Parallel Monte Carlo and Machine Learning Library
See the latest version documentation. |
|
|
ParaMonte MATLAB 3.0.0
Parallel Monte Carlo and Machine Learning Library
See the latest version documentation. |

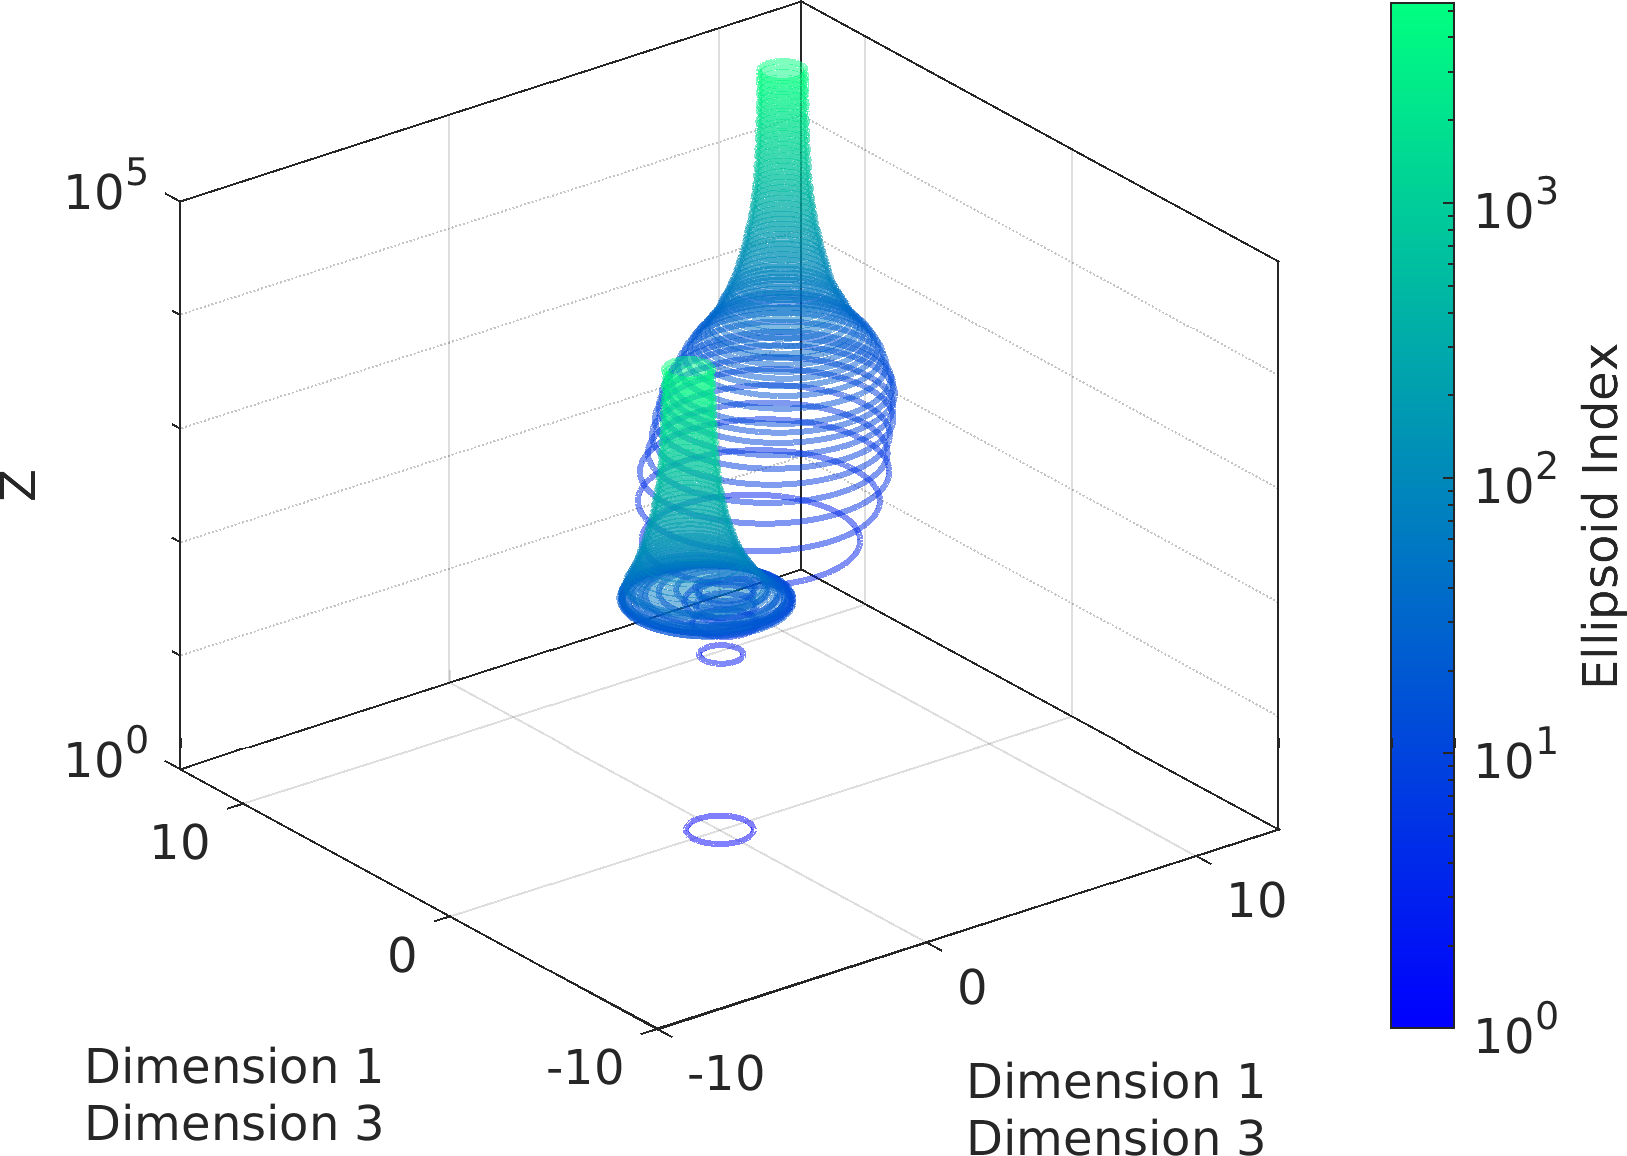
This is the SubplotEllipse3 class for generating instances of 3-dimensional Ellipse Subplot visualizations based on the relevant MATLAB intrinsic functions.
More...

Public Member Functions | |
| function | SubplotEllipse3 (in gramian, in center, in zval, in cval, in varargin) |
| Construct and return an object of class pm.vis.SubplotEllipse. More... | |
| function | reset (in self, in varargin) |
| Reset the properties of the plot to the original default settings. More... | |
| function | premake (in self, in varargin) |
| Prepare the subplot for visualization. More... | |
| function | make (in self, in varargin) |
| Generate a plot from the selected dimensions of the input ellipsoid data to the object constructor. More... | |
Data Fields | |
| Property | names |
| Property | dimx |
| Property | dimy |
| Property | ellindex |
| Property | gramian |
| Property | center |
| Property | zval |
| Property | cval |
| Property | ndim |
| Property | nell |
| Property | npnt |
| Property | workspace |
This is the SubplotEllipse3 class for generating instances of 3-dimensional Ellipse Subplot visualizations based on the relevant MATLAB intrinsic functions.
Final Remarks ⛓
If you believe this algorithm or its documentation can be improved, we appreciate your contribution and help to edit this page's documentation and source file on GitHub.
For details on the naming abbreviations, see this page.
For details on the naming conventions, see this page.
This software is distributed under the MIT license with additional terms outlined below.
This software is available to the public under a highly permissive license.
Help us justify its continued development and maintenance by acknowledging its benefit to society, distributing it, and contributing to it.
Definition at line 27 of file SubplotEllipse3.m.
| function SubplotEllipse3::SubplotEllipse3 | ( | in | gramian, |
| in | center, | ||
| in | zval, | ||
| in | cval, | ||
| in | varargin | ||
| ) |
Construct and return an object of class pm.vis.SubplotEllipse.
In the following documentation,
The variable ndim represents the number of ellipsoids in the input data.
The value of ndim is inferred from the shapes of the input gramian and center arguments as max([2, size(gramian, 1), size(center, 1)]).
The variable nell represents the number of ellipsoids in the input data.
The value of nell is inferred from the shapes of the input gramian, center, zval, and cval arguments as max([size(gramian, 3), size(center, 2), size(zval, 2), size(cval, 2)]).
If the above expression yields zero, then nell is set to 75.
npnt represents the number of points used in visualizing each ellipsoid.npnt is inferred from the shapes of the input arguments zval and czval as max(size(zval, 1), size(cval, 1)).npnt is set to 100.| [in] | gramian | : The MATLAB (function handle returning an) object that can be either,
|
| [in] | center | : The MATLAB (function handle returning an) object that can be either,
|
| [in] | zval | : The MATLAB (function handle returning an) object that can be either,
|
| [in] | cval | : The MATLAB (function handle returning an) object that can be either,
The input value for cval is used only if colormap.enabled component of the output object of class pm.vis.SubplotEllipse3 is set to true. |
| [in] | varargin | : Any property, value pair of the object.If the property is a struct(), then its value must be given as a cell array, with consecutive elements representing the struct property-name, property-value pairs.Note that all of these property-value pairs can be also directly set via the parent object attributes, before calling the make() method. |
self : The output object of class pm.vis.SubplotEllipse3.
Possible calling interfaces ⛓
view(2) to change the camera view to 2D.
Example usage ⛓
Final Remarks ⛓
If you believe this algorithm or its documentation can be improved, we appreciate your contribution and help to edit this page's documentation and source file on GitHub.
For details on the naming abbreviations, see this page.
For details on the naming conventions, see this page.
This software is distributed under the MIT license with additional terms outlined below.
This software is available to the public under a highly permissive license.
Help us justify its continued development and maintenance by acknowledging its benefit to society, distributing it, and contributing to it.
| function SubplotEllipse3::make | ( | in | self, |
| in | varargin | ||
| ) |
Generate a plot from the selected dimensions of the input ellipsoid data to the object constructor.
fout component.| [in,out] | self | : The input/output parent object of class pm.vis.SubplotEllipse3 which is implicitly passed to this dynamic method (not by the user). |
| [in] | varargin | : Any property, value pair of the parent object.If the property is a struct(), then its value must be given as a cell array, with consecutive elements representing the struct property-name, property-value pairs.Note that all of these property-value pairs can be also directly set via the parent object attributes, before calling the make() method. |
Possible calling interfaces ⛓
Example usage ⛓
Final Remarks ⛓
If you believe this algorithm or its documentation can be improved, we appreciate your contribution and help to edit this page's documentation and source file on GitHub.
For details on the naming abbreviations, see this page.
For details on the naming conventions, see this page.
This software is distributed under the MIT license with additional terms outlined below.
This software is available to the public under a highly permissive license.
Help us justify its continued development and maintenance by acknowledging its benefit to society, distributing it, and contributing to it.
| function SubplotEllipse3::premake | ( | in | self, |
| in | varargin | ||
| ) |
Prepare the subplot for visualization.
| [in,out] | self | : The input/output parent object of class pm.vis.SubplotEllipse3 which is implicitly passed to this dynamic method (not by the user). |
| [in] | varargin | : Any property, value pair of the parent object.If the property is a struct(), then its value must be given as a cell array, with consecutive elements representing the struct property-name, property-value pairs.Note that all of these property-value pairs can be also directly set via the parent object attributes, before calling the premake() method. |
Possible calling interfaces ⛓
Example usage ⛓
Final Remarks ⛓
If you believe this algorithm or its documentation can be improved, we appreciate your contribution and help to edit this page's documentation and source file on GitHub.
For details on the naming abbreviations, see this page.
For details on the naming conventions, see this page.
This software is distributed under the MIT license with additional terms outlined below.
This software is available to the public under a highly permissive license.
Help us justify its continued development and maintenance by acknowledging its benefit to society, distributing it, and contributing to it.
| function SubplotEllipse3::reset | ( | in | self, |
| in | varargin | ||
| ) |
Reset the properties of the plot to the original default settings.
Use this method when you change many attributes of the plot and you want to clean up and go back to the default settings.
| [in,out] | self | : The implicitly-passed input argument representing the parent object of the method. |
| [in] | varargin | : Any property, value pair of the parent object.If the property is a struct(), then its value must be given as a cell array, with consecutive elements representing the struct property-name, property-value pairs.Note that all of these property-value pairs can be also directly set via the parent object attributes, before calling the make() method. |
Possible calling interfaces ⛓
Final Remarks ⛓
If you believe this algorithm or its documentation can be improved, we appreciate your contribution and help to edit this page's documentation and source file on GitHub.
For details on the naming abbreviations, see this page.
For details on the naming conventions, see this page.
This software is distributed under the MIT license with additional terms outlined below.
This software is available to the public under a highly permissive license.
Help us justify its continued development and maintenance by acknowledging its benefit to society, distributing it, and contributing to it.
| Property SubplotEllipse3::center |
center
A scalar object of class pm.container.DataRef containing the user-specified center data to visualize.
Definition at line 87 of file SubplotEllipse3.m.
| Property SubplotEllipse3::cval |
cval
A scalar object of class pm.container.DataRef containing the user-specified color data in colormap.
If empty or unspecified, it will be set to zval component.
Definition at line 104 of file SubplotEllipse3.m.
| Property SubplotEllipse3::dimx |
dimx
The MATLAB scalar (or vector) of whole-number(s) representing the dimension(s) of the input gramian and center data to be used on the x-axis of 2D ellipsoid visualization.
The default is 1 if dimy component is also unspecified, or the appropriate data column adjacent to dimmy.
If the condition dimx == dimy holds, then the resulting ellipses will be circles.
Definition at line 50 of file SubplotEllipse3.m.
| Property SubplotEllipse3::dimy |
dimy
The MATLAB scalar (or vector) of whole-number(s) representing the dimension(s) of the input gramian and center data to be used on the y-axis of 2D ellipsoid visualization.
The default is 1 if dimx component is also unspecified, or the appropriate data column adjacent to dimmx.
If the condition dimx == dimy holds, then the resulting ellipses will be circles.
Definition at line 60 of file SubplotEllipse3.m.
| Property SubplotEllipse3::ellindex |
ellindex
The vector of MATLAB whole numbers representing the ellindex of the 2D ellipsoids to display, represented by the input gramian and center.
The specified ellindex will serve as the visualization values on the z-axis.
The default is ellindex = pm.array.logrange(start = 1, stop = nell, count = 75);, where nell represents the number of ellipsoids to visualize.
Definition at line 71 of file SubplotEllipse3.m.
| Property SubplotEllipse3::gramian |
gramian
A scalar object of class pm.container.DataRef containing the user-specified Gramian data to visualize.
Definition at line 79 of file SubplotEllipse3.m.
| Property SubplotEllipse3::names |
names
The vector of MATLAB strings containing the names of dimensions of the space within which the Gramian matrices are defined.
The default is "Dimension i" where i is replaced by the ID of the corresponding axis.
Definition at line 40 of file SubplotEllipse3.m.
| Property SubplotEllipse3::ndim |
ndim
A scalar MATLAB whole number representing the total number of the dimensions of ellipsoids identified based on the input that can be visualized.
It is set to max(2, size(gramian, 2), size(center, 1)).
Definition at line 116 of file SubplotEllipse3.m.
| Property SubplotEllipse3::nell |
nell
A scalar MATLAB whole number representing the total number of ellipsoids identified based on the input that can be visualized.
It is set to max(20, size(gramian, 3), size(center, 2), size(zval, 2)).
Definition at line 125 of file SubplotEllipse3.m.
| Property SubplotEllipse3::npnt |
npnt
The scalar MATLAB whole number representing the number of points with which the 2D ellipsoid boundaries are delineated.
It is set to max(size(zval, 1), size(cval, 1)) or otherwise, 100.
Definition at line 134 of file SubplotEllipse3.m.
| Property SubplotEllipse3::workspace |
workspace
A scalar MATLAB struct() containing the current visualization information.
This information is updated with every call to the make() method.
The contents of this component are temporary and must remain read-only.
This component is solely provided for better insight into the internal workings of the make() method of the parent object and the resulting visualization.
Definition at line 146 of file SubplotEllipse3.m.
| Property SubplotEllipse3::zval |
zval
A scalar object of class pm.container.DataRef containing the user-specified z-axis data to visualize.
Definition at line 95 of file SubplotEllipse3.m.

