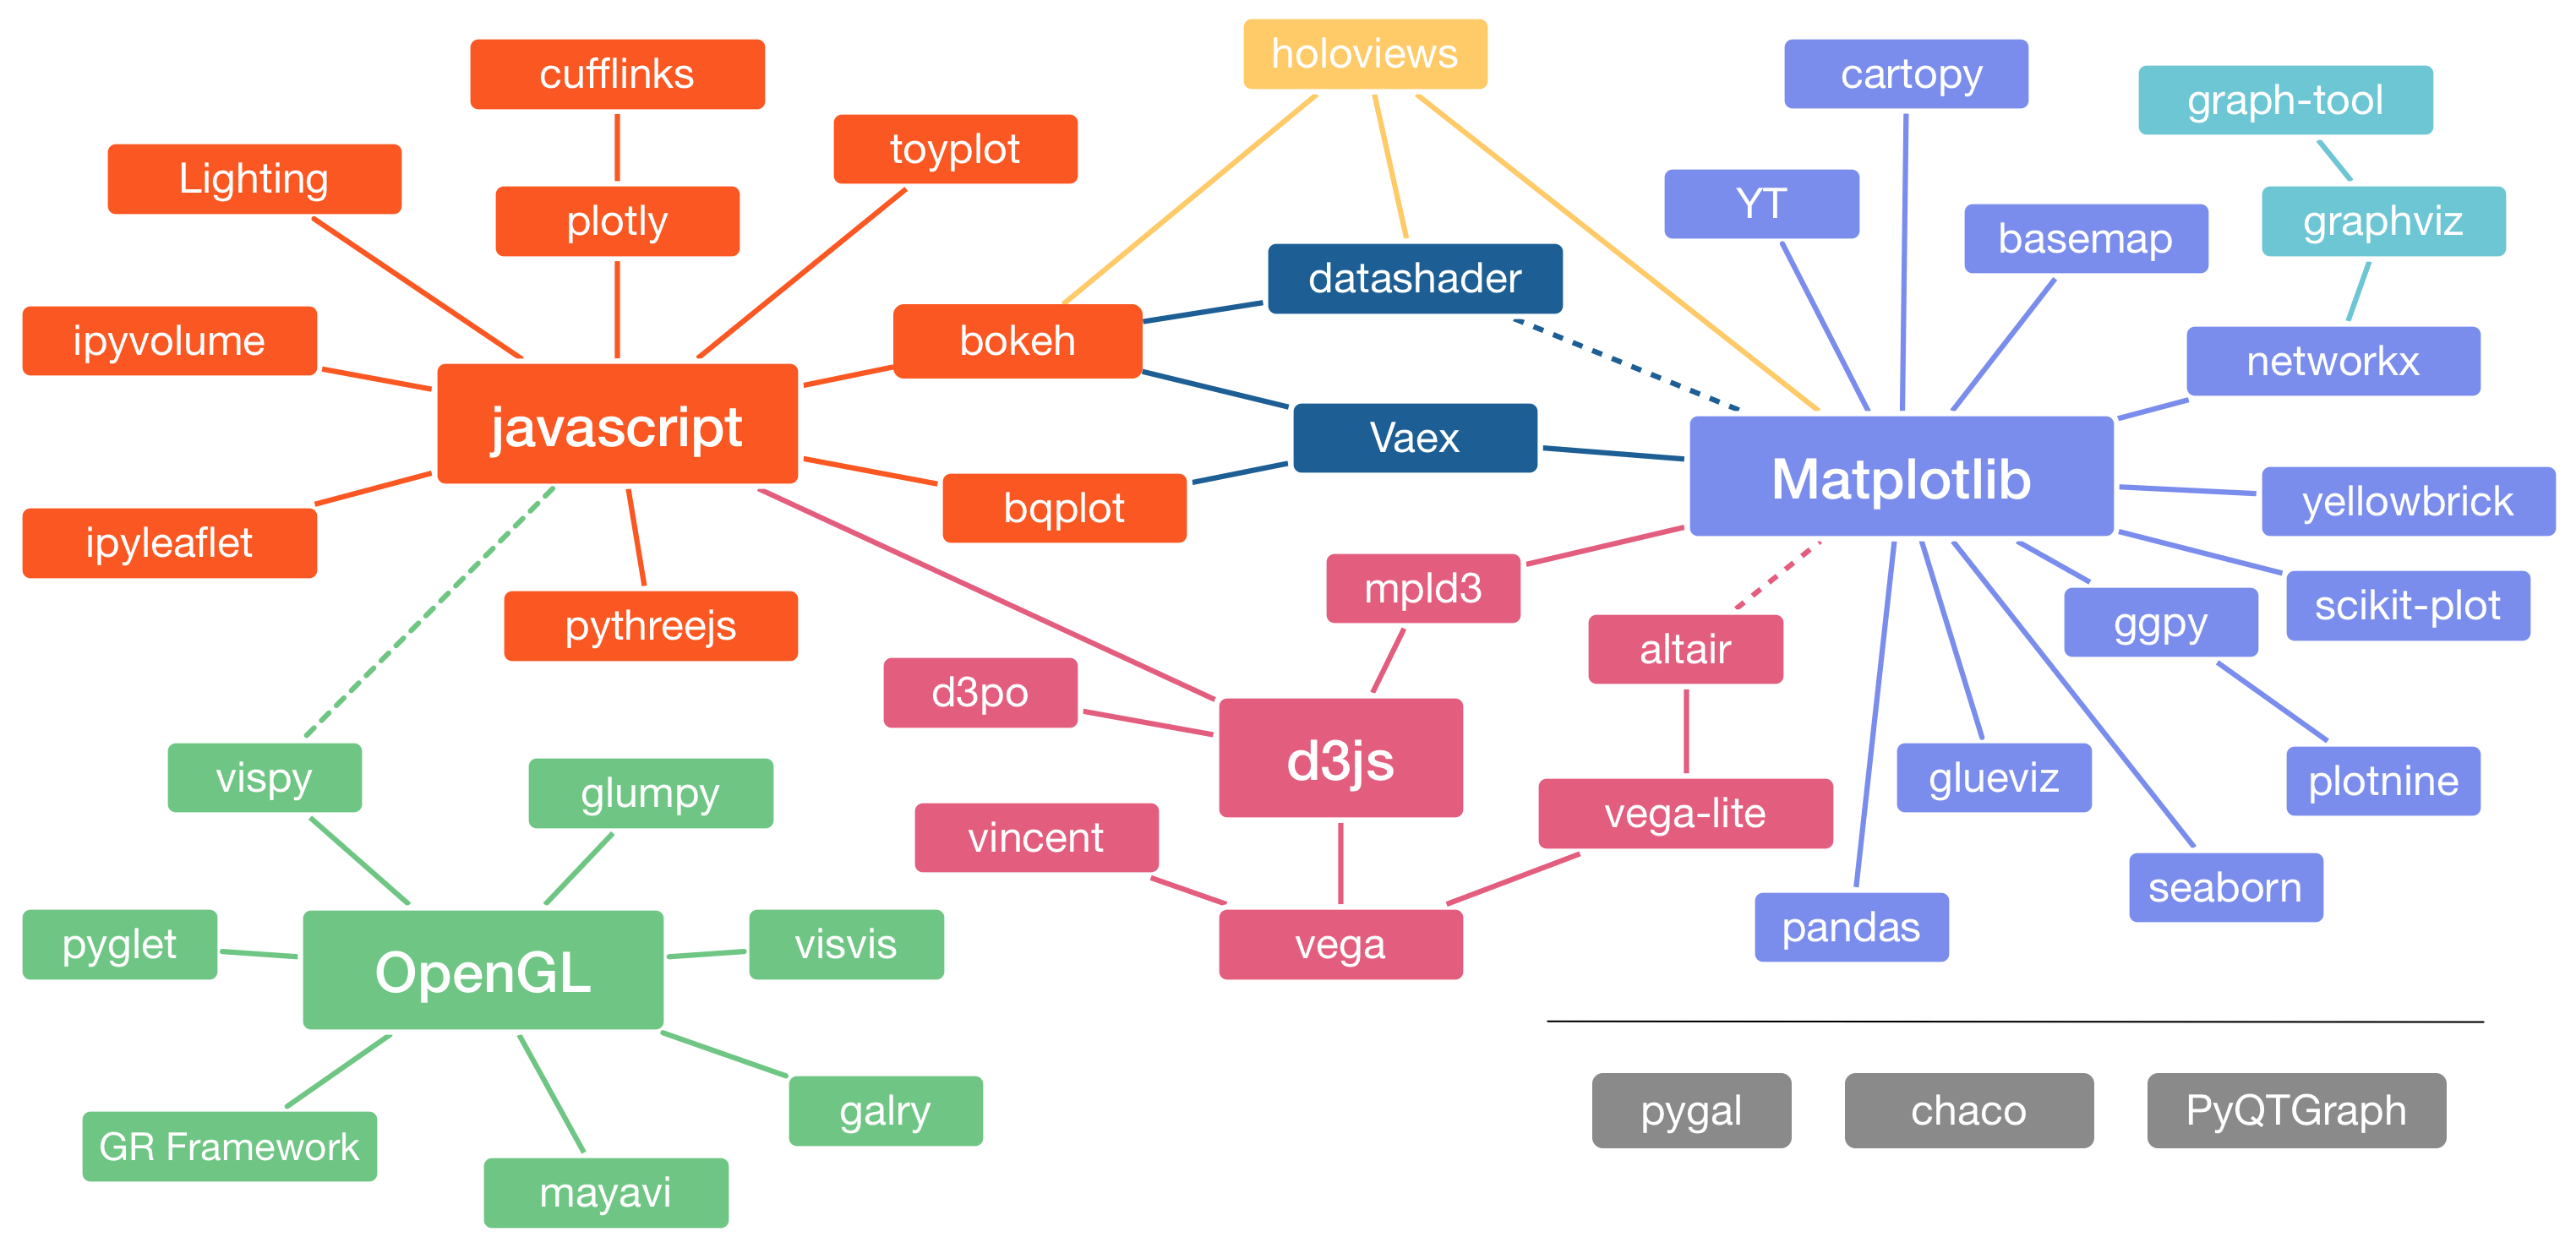
Overview of visualization methods and tools in Python
Because of the very large community of Python programmers and users and due to the lack of a unique consistent standardized visualization package in Python, a myriad of Python visualization packages have been developed beginning with the new millennium. As a result, plotting and visualization with Python have become rather confusing and the appropriate choice of tools is not obvious to many, in particular beginning, programmers. As of 2017, there has been, however, some recent efforts to bring order, organization, and convergence to the heterogeneous landscape of visualization tools in Python.
Aside from causing confusion, the availability of many options for visualization in Python can be considered one of its strengths as each of these tools tend to specialize on a specific type of visualization problems depending on the size of input data, type of plots needed, and the ultimate usage of the output visualization. For a summary classification of Python visualization tools see this pdf file.

matplotlib, the workhorse of plotting in Python
The workhorse of visualization and plotting in Python is matplotlib which is a Python 2D and 3D plotting library capable of producing publication quality figures. The main component of matplotlib is pyplot, a matplotlib module which provides a MATLAB-like interface for Python, while being free and open-source. As a result, the usage of matplotlib is very similar to MATLAB.
There are many tutorials and example problems using matplotlib on the web that you can refer to. However, as a general recommendation, given the extreme heterogeneity of Python’s programmers’ community and the myriad of tools and approaches to visualization that are available in Python, I highly recommend using tools and recourses from reputable people/organizations that are known for the continuous work and development in Python. You don’t want to write a code that does not work in a few weeks or months because of the poor maintenance of the libraries upon which your code has been developed. Here is a tutorial on matplotlib, advertised by Enthought.
Other plotting packages
For more complicated 2D/3D or vector field plotting, you may find matplotlib inadequate. To address these inadequacies, other packages have been developed which provide an interface to more advanced plotting software such as, MATLAB, Gnuplot, Grace, OpenDX, VTK, and others.
Easyviz from SciTools
Because each of the above-mentioned visualization software has its own plotting syntax, a Python module easyviz has been developed which provides a universal interface for any of the above-mentioned back-end plotting software. In other words, the user can request eazyvis to use one of the above-mentioned software as the plotting engine in Python, while the syntax of the Python code is universal and the same for all of them, and this is achieved by using eazyvis. Just like matplotlib, the syntax of eazyvis has been also purposefully made very similar to MATLAB.
The Easyviz module is part of the SciTools package, which consists of a set of Python tools building on Numerical Python, ScientificPython, the comprehensive SciPy environment, and other packages for scientific computing with Python. However, keep in mind that SciTools strictly requires Python v2.7 and Numerical Python.
Mayavi visualization package
Mayavi is another advanced, free, scientific data visualizer for Python, with emphasis on three-dimensional visualization techniques. The package is written in Python, and uses the Visualization Toolkit (VTK) in C++ for rendering graphics. Since VTK can be configured with different backends, so can Mayavi. Mayavi is cross-platform and runs on most platforms like Mac OS X, Windows, and Linux.
More visualization packages
There are many more Python visualization packages that have not been discussed here, for example, Bokeh, Seaborn, HoloViz, etc, each one of which has been developed with a specific visualization goal in mind. For a list of tutorials on some of these packages, visit pyviz.org.