|
|
ParaMonte MATLAB 3.0.0
Parallel Monte Carlo and Machine Learning Library
See the latest version documentation. |
|
|
ParaMonte MATLAB 3.0.0
Parallel Monte Carlo and Machine Learning Library
See the latest version documentation. |

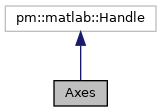
This is the class for generating instances of objects that contain the specifications of various types of plots.
More...

Public Member Functions | |
| function | Axes (in ptype, in varargin) |
| Construct and return an object of class pm.vis.axes.Axes. More... | |
| function | reset (in self, in varargin) |
| Reset the properties of the plot to the original default settings and return nothing. More... | |
| function | premake (in self, in varargin) |
| Configure the plot settings and specifications and return nothing. More... | |
| function | comp2hash (in self, in comp) |
Convert the components of the input component comp of the parent object into a cell array of key-val pairs.More... | |
Data Fields | |
| Property | silent |
| Property | type |
| Property | cenabled |
This is the class for generating instances of objects that contain the specifications of various types of plots.
This class primarily serves as the superclass for the visualization-ready subclass pm.vis.Subplot and its subclasses, all accessible to the end users.
This class contains a set of attributes that are defined dynamically at runtime for the output object depending on its subclass (plot type it represents).
The following is the list of all class attributes that are dynamically added to the instantiated class objects based on the specified input plot type.
See also the explicit class and superclass attributes not listed below.
axes (available for all subplots except pm.vis.SubplotHeatmap)
A MATLAB struct whose fields and values are passed as keyword arguments to the MATLAB intrinsic set() for the current active axes object in the plot gca().
colorbar (available for all axes types that allow color-mapping)
A MATLAB struct whose fields and their values will be passed as keyword arguments to the MATLAB intrinsic colorbar.
The following are the default components of colorbar:
enabled
A logical value. If true, the color bar will be applied to the axes.
others
See the acceptable keyword arguments of the MATLAB intrinsic colorbar().
colorbar.color and colorbar.Color are the same, and only one of the two will be processed.
Example usage ⛓
colormap (available for all axes types that allow color-mapping)
A MATLAB struct whose fields and their values will be passed as keyword arguments to the MATLAB intrinsic colormap.
The following are the default components of colormap:
enabled
A logical value. If true, the colormap will be applied to the axes.
map
A string or a vector of color triplets or any other value that the intrinsic MATLAB colormap accepts as input.
This option is relevant only to visualizations that allow color-mapping.
colormap.map and colormap.Map are the same, and only one of the two will be processed.
Example usage ⛓
contour (available only for pm.vis.SubplotContour axes types)
A MATLAB struct whose fields and their values will be passed as keyword arguments to the MATLAB intrinsic contour.
The following are the default components of contour:
enabled
A logical value. If true, the contour will be added to the axes.
levels
See the corresponding positional argument of the MATLAB intrinsic contourf().
lineSpec
See the corresponding positional argument of the MATLAB intrinsic contourf().
others
See the acceptable keyword arguments of the MATLAB intrinsic contour().
Example usage ⛓
contour3 (available only for pm.vis.SubplotContour3 axes types)
A MATLAB struct whose fields and their values will be passed as keyword arguments to the MATLAB intrinsic contour3.
The following are the default components of contour3:
enabled
A logical value. If true, the contour3 will be added to the axes.
levels
See the corresponding positional argument of the MATLAB intrinsic contourf().
lineSpec
See the corresponding positional argument of the MATLAB intrinsic contourf().
others
See the acceptable keyword arguments of the MATLAB intrinsic contour3().
Example usage ⛓
contourf (available only for pm.vis.SubplotContourf axes types)
A MATLAB struct whose fields and their values will be passed as keyword arguments to the MATLAB intrinsic contourf.
The following are the default components of contourf:
enabled
A logical value. If true, the contourf will be added to the axes.
levels
See the corresponding positional argument of the MATLAB intrinsic contourf().
lineSpec
See the corresponding positional argument of the MATLAB intrinsic contourf().
others
See the acceptable keyword arguments of the MATLAB intrinsic contourf().
Example usage ⛓
histfit (available only for pm.vis.SubplotHistfit axes types)
A MATLAB struct whose fields and their values will be passed as keyword arguments to the MATLAB intrinsic histfit.
The following are the default components of histfit:
enabled
A logical value. If true, the histfit will be added to the axes.
nbins
See the corresponding positional argument of the MATLAB intrinsic histfit().
dist
See the corresponding positional argument of the MATLAB intrinsic histfit().
Example usage ⛓
histogram (available only for pm.vis.SubplotHistogram axes types)
A MATLAB struct whose fields and their values will be passed as keyword arguments to the MATLAB intrinsic histogram.
The following are the default components of histogram:
enabled
A logical value. If true, the histogram will be added to the axes.
nbins
See the corresponding positional argument of the MATLAB intrinsic histogram().
edges
See the corresponding positional argument of the MATLAB intrinsic histogram().
others
See the corresponding acceptable keyword arguments of the MATLAB intrinsic histogram().
Example usage ⛓
histogram2 (available only for pm.vis.SubplotHistogram2 axes types)
A MATLAB struct whose fields and their values will be passed as keyword arguments to the MATLAB intrinsic histogram2.
The following are the default components of histogram2:
enabled
A logical value. If true, the histogram2 will be added to the axes.
nbins
See the corresponding positional argument of the MATLAB intrinsic histogram2().
xedges
See the corresponding positional argument of the MATLAB intrinsic histogram2().
yedges
See the corresponding positional argument of the MATLAB intrinsic histogram2().
others
See the corresponding acceptable keyword arguments of the MATLAB intrinsic histogram2().
Example usage ⛓
legend (available for all axes types except pm.vis.SubplotHeatmap)
A MATLAB struct whose fields and values are passed as keyword arguments to the MATLAB intrinsic title().
maxnoise (available only for pm.vis.SubplotContour/pm.vis.SubplotContourf/pm.vis.SubplotContour3 axes types)
A float indicating the threshold below which the kernel density estimate is considered to be noise and is rounded to zero.
The higher this value is, the less noise will be visible in the resulting contour plots.
If empty, the default value is 0.001.
plot (available only for pm.vis.SubplotLine, pm.vis.SubplotLineScatter axes types)
A MATLAB struct whose fields and their values will be passed as keyword arguments to the MATLAB intrinsic plot.
The following are the default components of plot:
enabled
A logical value. If true, the plot will be added to the axes.
lineSpec
See the corresponding positional argument of the MATLAB intrinsic plot().
others
See the corresponding acceptable keyword arguments of the MATLAB intrinsic plot().
Example usage ⛓
plot3 (available only for pm.vis.SubplotLine3/pm.vis.SubplotLineScatter3 axes types)
A MATLAB struct whose fields and their values will be passed as keyword arguments to the MATLAB intrinsic plot3.
The following are the default components of plot3:
enabled
A logical value. If true, the plot3 will be added to the axes.
lineSpec
See the corresponding positional argument of the MATLAB intrinsic plot3().
others
See the corresponding acceptable keyword arguments of the MATLAB intrinsic plot3().
Example usage ⛓
precision (available only for pm.vis.SubplotHeatmap axes types)
A scalar integer representing the number of digits after the decimal point for the values that appear in each cell of the heatmap. The default value is set by MATLAB.
resolution (available only for pm.vis.SubplotContour, pm.vis.SubplotContourf, pm.vis.SubplotContour3 axes types)
A scalar integer indicating the grid resolution for discretization of the data during the kernel density estimation. It must be a power of two, otherwise it will be changed to the next power of two at the time of using it. If empty, the default value is 2^9.
scatter (available only for pm.vis.SubplotScatter, pm.vis.SubplotLineScatter axes types)
A MATLAB struct whose fields and their values will be passed as keyword arguments to the MATLAB intrinsic scatter.
The following are the default components of scatter:
enabled
A logical value. If true, the scatter will be added to the axes.
size
See the corresponding sz positional argument of the MATLAB intrinsic plot3().
color
See the corresponding C positional argument of the MATLAB intrinsic plot3().
filled
See the corresponding filled positional argument of the MATLAB intrinsic plot3().
marker
See the corresponding mkr positional argument of the MATLAB intrinsic plot3().
others
See the corresponding acceptable keyword arguments of the MATLAB intrinsic scatter().
Example usage ⛓
scatter3 (available only for pm.vis.SubplotScatter3, pm.vis.SubplotLineScatter3 axes types)
A MATLAB struct whose fields and their values will be passed as keyword arguments to the MATLAB intrinsic scatter3.
The following are the default components of scatter3:
enabled
A logical value. If true, the scatter3 will be added to the axes.
size
See the corresponding sz positional argument of the MATLAB intrinsic plot3().
color
See the corresponding C positional argument of the MATLAB intrinsic plot3().
filled
See the corresponding filled positional argument of the MATLAB intrinsic plot3().
marker
See the corresponding mkr positional argument of the MATLAB intrinsic plot3().
others
See the corresponding acceptable keyword arguments of the MATLAB intrinsic scatter3().
Example usage ⛓
surface (available only for pm.vis.SubplotLine, pm.vis.SubplotLineScatter, pm.vis.SubplotLine3/pm.vis.SubplotLineScatter3 axes types)
A MATLAB struct whose fields and their values will be passed as keyword arguments to the MATLAB intrinsic surface.
The following are the default components of surface:
enabled
A logical value. If true, the surface will be added to the axes.
others
See the corresponding acceptable keyword arguments of the MATLAB intrinsic surface().
Example usage ⛓
title (available for all axes types)
A MATLAB struct whose fields and values are passed as keyword arguments to the MATLAB intrinsic title().
xlabel (available for all axes types)
A MATLAB struct whose fields and values are passed as keyword arguments to the MATLAB intrinsic xlabel().
ylabel (available for all axes types)
A MATLAB struct whose fields and values are passed as keyword arguments to the MATLAB intrinsic ylabel().
zlabel (available only for all tri-axes axes types)
A MATLAB struct whose fields and values are passed as keyword arguments to the MATLAB intrinsic zlabel().
xlim (available for all axes types, except pm.vis.SubplotHeatmap)
A MATLAB vector of length 2 whose fields and values are passed as keyword arguments to the MATLAB intrinsic xlim().
ylim (available for all axes types, except pm.vis.SubplotHeatmap)
A MATLAB vector of length 2 whose fields and values are passed as keyword arguments to the MATLAB intrinsic ylim().
zlim (available only for all tri-axes axes types)
A MATLAB vector of length 2 whose fields and values are passed as keyword arguments to the MATLAB intrinsic zlim().
xscale (available for all axes types, except pm.vis.SubplotHeatmap)
A MATLAB string whose value is passed directly to the MATLAB intrinsic xscale() to set the axis scale to either logarithmic or linear.
Possible values are: "log", "linear".
The default behavior is set by MATLAB.
yscale (available for all axes types, except pm.vis.SubplotHeatmap)
A MATLAB string whose value is passed directly to the MATLAB intrinsic yscale() to set the axis scale to either logarithmic or linear.
Possible values are: "log", "linear".
The default behavior is set by MATLAB.
zscale (available only for all tri-axes axes types)
A MATLAB string whose value is passed directly to the MATLAB intrinsic zscale() to set the axis scale to either logarithmic or linear.
Possible values are: "log", "linear".
The default behavior is set by MATLAB.
Final Remarks ⛓
If you believe this algorithm or its documentation can be improved, we appreciate your contribution and help to edit this page's documentation and source file on GitHub.
For details on the naming abbreviations, see this page.
For details on the naming conventions, see this page.
This software is distributed under the MIT license with additional terms outlined below.
This software is available to the public under a highly permissive license.
Help us justify its continued development and maintenance by acknowledging its benefit to society, distributing it, and contributing to it.
| function Axes::Axes | ( | in | ptype, |
| in | varargin | ||
| ) |
Construct and return an object of class pm.vis.axes.Axes.
This function is the constructor of the class pm.vis.axes.Axes.
For more information, see the documentation of the class pm.vis.axes.Axes.
| [in] | ptype | : The input scalar MATLAB string containing the name of the subclass that whose parent is Axes (e.g., "heatmap"). Supported plot names are:
|
| [in] | varargin | : Any property, value pair of the object.If the property is a struct(), then its value must be given as a cell array, with consecutive elements representing the struct property-name, property-value pairs.Note that all of these property-value pairs can be also directly set via the parent object attributes, before calling the premake() method. |
self : The output scalar object of class pm.vis.axes.Axes.
Possible calling interfaces ⛓
Example usage ⛓
Final Remarks ⛓
If you believe this algorithm or its documentation can be improved, we appreciate your contribution and help to edit this page's documentation and source file on GitHub.
For details on the naming abbreviations, see this page.
For details on the naming conventions, see this page.
This software is distributed under the MIT license with additional terms outlined below.
This software is available to the public under a highly permissive license.
Help us justify its continued development and maintenance by acknowledging its benefit to society, distributing it, and contributing to it.
| function Axes::comp2hash | ( | in | self, |
| in | comp | ||
| ) |
Convert the components of the input component comp of the parent object into a cell array of key-val pairs.
This is a dynamic method of the class pm.vis.axes.Axes.
This method is used internally by the subclasses to convert the parent object attributes to input arguments of MATLAB intrinsic visualization functions.
| [in,out] | self | : The input/output parent object of class pm.vis.axes.Axes which is implicitly passed to this dynamic method (not by the user). |
| [in] | comp | : The input scalar MATLAB string representing the name of a struct component of the parent object, whose fields names and values are to be returned as subsequent pairs in the output hash cell array. |
hash : The output cell array containing the pairs of field-name, field-value of the input MATLAB struct comp.
Possible calling interfaces ⛓
Example usage ⛓
Final Remarks ⛓
If you believe this algorithm or its documentation can be improved, we appreciate your contribution and help to edit this page's documentation and source file on GitHub.
For details on the naming abbreviations, see this page.
For details on the naming conventions, see this page.
This software is distributed under the MIT license with additional terms outlined below.
This software is available to the public under a highly permissive license.
Help us justify its continued development and maintenance by acknowledging its benefit to society, distributing it, and contributing to it.
| function Axes::premake | ( | in | self, |
| in | varargin | ||
| ) |
Configure the plot settings and specifications and return nothing.
| [in,out] | self | : The input/output parent object of class pm.vis.axes.Axes which is implicitly passed to this dynamic method (not by the user). |
| [in] | varargin | : Any property, value pair of the parent object.If the property is a struct(), then its value must be given as a cell array, with consecutive elements representing the struct property-name, property-value pairs.Note that all of these property-value pairs can be also directly set via the parent object attributes, before calling the premake() method. |
Possible calling interfaces ⛓
Example usage ⛓
Final Remarks ⛓
If you believe this algorithm or its documentation can be improved, we appreciate your contribution and help to edit this page's documentation and source file on GitHub.
For details on the naming abbreviations, see this page.
For details on the naming conventions, see this page.
This software is distributed under the MIT license with additional terms outlined below.
This software is available to the public under a highly permissive license.
Help us justify its continued development and maintenance by acknowledging its benefit to society, distributing it, and contributing to it.
| function Axes::reset | ( | in | self, |
| in | varargin | ||
| ) |
Reset the properties of the plot to the original default settings and return nothing.
Use this method when you change many attributes of the plot and you want to clean up and go back to the default settings.
| [in,out] | self | : The input/output parent object of class pm.vis.axes.Axes which is implicitly passed to this dynamic method (not by the user). |
| [in] | varargin | : Any property, value pair of the parent object.If the property is a struct(), then its value must be given as a cell array, with consecutive elements representing the struct property-name, property-value pairs.Note that all of these property-value pairs can be also directly set via the parent object attributes. |
Possible calling interfaces ⛓
Final Remarks ⛓
If you believe this algorithm or its documentation can be improved, we appreciate your contribution and help to edit this page's documentation and source file on GitHub.
For details on the naming abbreviations, see this page.
For details on the naming conventions, see this page.
This software is distributed under the MIT license with additional terms outlined below.
This software is available to the public under a highly permissive license.
Help us justify its continued development and maintenance by acknowledging its benefit to society, distributing it, and contributing to it.
| Property Axes::cenabled |
| Property Axes::silent |
| Property Axes::type |

