ParaMonte MATLAB 3.0.0
Parallel Monte Carlo and Machine Learning Library
See the latest version documentation.
Cor Class Reference

This is the base class for generating objects with methods and storage components for computing, storing, and visualizing the correlation matrix of an input data.
More...
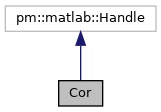
Inheritance diagram for Cor:
Collaboration diagram for Cor:

Public Member Functions

function Cor (in dfref, in method)
 Return an object of class pm.stats.Cor.
More...
 
function get (in self, in dfref, in method)
 Return the correlation matrix of the input data.
More...
 
function setvis (in self, in val)
 Set up the visualization tools of the correlation matrix.
More...
 

Detailed Description

This is the base class for generating objects with methods and storage components for computing, storing, and visualizing the correlation matrix of an input data.

This is convenience class for easy correlation computation and its storage and visualization all in one place.
The primary advantage of this class over the MATLAB intrinsic functions is in the ability of this class to compute the result for input dataframe table and return the results always in MATLAB table format.

Note
See the documentation of the class constructor below.
See also the documentation of the superclass pm.stats.Cov.


Final Remarks


If you believe this algorithm or its documentation can be improved, we appreciate your contribution and help to edit this page's documentation and source file on GitHub.
For details on the naming abbreviations, see this page.
For details on the naming conventions, see this page.
This software is distributed under the MIT license with additional terms outlined below.

  1. If you use any parts or concepts from this library to any extent, please acknowledge the usage by citing the relevant publications of the ParaMonte library.
  2. If you regenerate any parts/ideas from this library in a programming environment other than those currently supported by this ParaMonte library (i.e., other than C, C++, Fortran, MATLAB, Python, R), please also ask the end users to cite this original ParaMonte library.

This software is available to the public under a highly permissive license.
Help us justify its continued development and maintenance by acknowledging its benefit to society, distributing it, and contributing to it.

Author:
Joshua Alexander Osborne, May 21 2024, 4:16 AM, University of Texas at Arlington
Fatemeh Bagheri, May 20 2024, 1:25 PM, NASA Goddard Space Flight Center (GSFC), Washington, D.C.
Amir Shahmoradi, May 16 2016, 9:03 AM, Oden Institute for Computational Engineering and Sciences (ICES), UT Austin

Definition at line 26 of file Cor.m.

Constructor & Destructor Documentation

◆ Cor()

function Cor::Cor ( in  dfref,
in  method 
)

Return an object of class pm.stats.Cor.

This is the constructor of the pm.stats.Cor class.

Parameters
[in]dfref: The input MATLAB matrix or table of rank 2 containing the data as ncol columns of nrow observations whose correlation matrix must be computed.
Ideally, the user would want to pass a reference to a dataframe (e.g., as a function handle @()df) so that the data remains dynamically up-to-date.
(optional. If missing or empty, the correlation matrix will not be computed.)
[in]method: The input scalar MATLAB string that can be either:
  1. "pearson" : for computing the Pearson correlation matrix of the input data.
  2. "kendall" : for computing the Kendall correlation matrix of the input data.
  3. "spearman" : for computing the Spearman rank correlation matrix of the input data.
(optional, default = "pearson")
Returns
self : The output object of class pm.stats.Cor.


Possible calling interfaces

mat = pm.stats.Cor([])
mat = pm.stats.Cor([], [])
mat = pm.stats.Cor([], method)
mat = pm.stats.Cor(dfref)
mat = pm.stats.Cor(dfref, [])
mat = pm.stats.Cor(dfref, method)


Example usage

1cd(fileparts(mfilename('fullpath'))); % Change working directory to source code directory.
2addpath('../../../'); % Add the ParaMonte library root directory to the search path.
3
4% Make a positive-definite random matrix.
5
6pm.matlab.show()
7pm.matlab.show("cholow = chol(pm.stats.dist.cov.getRand(5), 'lower');")
8 cholow = chol(pm.stats.dist.cov.getRand(5), 'lower');
9pm.matlab.show("df = pm.stats.dist.mvn.getRand(zeros(length(cholow), 1), cholow, 5000)';")
10 df = pm.stats.dist.mvn.getRand(zeros(length(cholow), 1), cholow, 5000)';
11
12pm.matlab.show()
13pm.matlab.show('c = pm.stats.Cor(df, "spearman"); c.val')
14 c = pm.stats.Cor(df, "spearman"); c.val
15
16pm.matlab.show()
17pm.matlab.show('c = pm.stats.Cor(df, "pearson"); c.val')
18 c = pm.stats.Cor(df, "pearson"); c.val
19
20pm.matlab.show()
21pm.matlab.show('c = pm.stats.Cor(df); c.val')
22 c = pm.stats.Cor(df); c.val
23
24pm.matlab.show()
25pm.matlab.show('c.vis.heatmap.make(); c.vis.heatmap.subplot.setColorLim();')
26 c.vis.heatmap.make(); c.vis.heatmap.subplot.setColorLim();
27pm.matlab.show('c.vis.heatmap.savefig("Cor.unifrnd.png", "-m3");')
28 c.vis.heatmap.savefig("Cor.unifrnd.png", "-m3");
function root()
Return a scalar MATLAB string containing the root directory of the ParaMonte library package.

Example output
1
2cholow = chol(pm.stats.dist.cov.getRand(5), 'lower');
3df = pm.stats.dist.mvn.getRand(zeros(length(cholow), 1), cholow, 5000)';
4
5c = pm.stats.Cor(df, "spearman"); c.val
6ans =
7 5x5 table
8 df1 df2 df3 df4 df5
9 __________________ __________________ __________________ __________________ __________________
10 df1 1 0.0373586092383444 0.394461329794453 -0.6525674912547 -0.655893857403754
11 df2 0.0373586092383444 1 -0.873586798559472 -0.137920086284803 0.628661519226461
12 df3 0.394461329794453 -0.873586798559472 1 -0.167224998113 -0.866223323512933
13 df4 -0.6525674912547 -0.137920086284803 -0.167224998113 1 0.506487876483515
14 df5 -0.655893857403754 0.628661519226461 -0.866223323512933 0.506487876483515 1
15
16c = pm.stats.Cor(df, "pearson"); c.val
17ans =
18 5x5 table
19 df1 df2 df3 df4 df5
20 __________________ __________________ __________________ __________________ __________________
21 df1 1 0.0373339730899272 0.410045277257906 -0.674297277063619 -0.672232559796714
22 df2 0.0373339730899272 1 -0.885305728566906 -0.139071767118483 0.651660531755493
23 df3 0.410045277257906 -0.885305728566906 1 -0.17976606856118 -0.878730433687118
24 df4 -0.674297277063619 -0.139071767118483 -0.17976606856118 1 0.526603549666696
25 df5 -0.672232559796714 0.651660531755493 -0.878730433687118 0.526603549666696 1
26
27c = pm.stats.Cor(df); c.val
28ans =
29 5x5 table
30 df1 df2 df3 df4 df5
31 __________________ __________________ __________________ __________________ __________________
32 df1 1 0.0373339730899272 0.410045277257906 -0.674297277063619 -0.672232559796714
33 df2 0.0373339730899272 1 -0.885305728566906 -0.139071767118483 0.651660531755493
34 df3 0.410045277257906 -0.885305728566906 1 -0.17976606856118 -0.878730433687118
35 df4 -0.674297277063619 -0.139071767118483 -0.17976606856118 1 0.526603549666696
36 df5 -0.672232559796714 0.651660531755493 -0.878730433687118 0.526603549666696 1
37
38c.vis.heatmap.make(); c.vis.heatmap.subplot.setColorLim();
39c.vis.heatmap.savefig("Cor.unifrnd.png", "-m3");

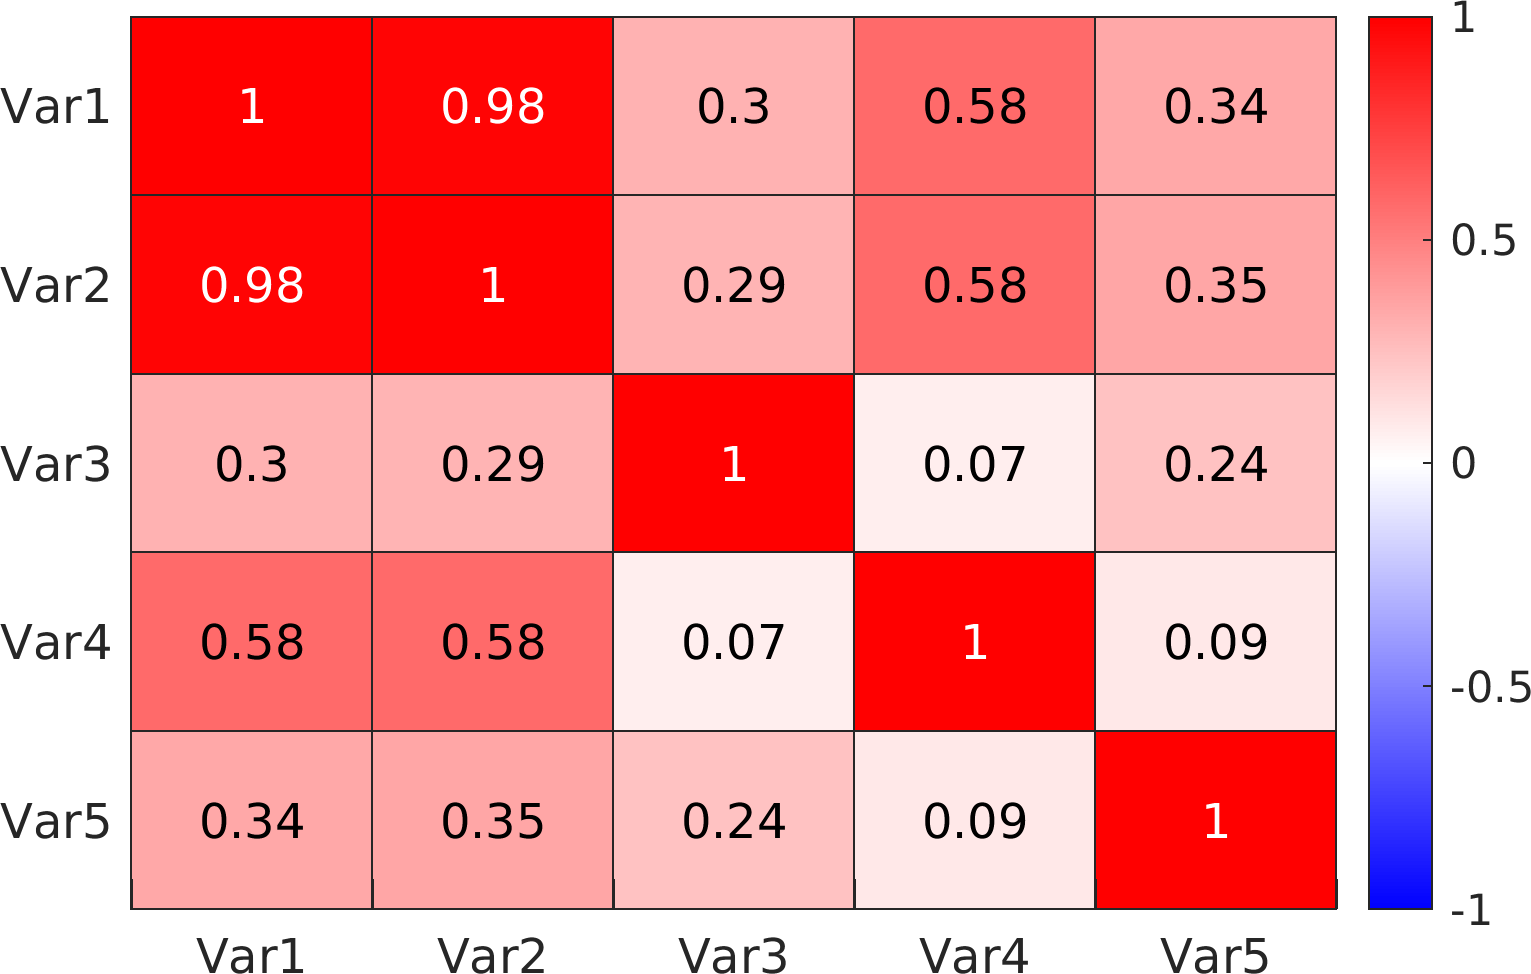
Visualization of the example output


Final Remarks


If you believe this algorithm or its documentation can be improved, we appreciate your contribution and help to edit this page's documentation and source file on GitHub.
For details on the naming abbreviations, see this page.
For details on the naming conventions, see this page.
This software is distributed under the MIT license with additional terms outlined below.

  1. If you use any parts or concepts from this library to any extent, please acknowledge the usage by citing the relevant publications of the ParaMonte library.
  2. If you regenerate any parts/ideas from this library in a programming environment other than those currently supported by this ParaMonte library (i.e., other than C, C++, Fortran, MATLAB, Python, R), please also ask the end users to cite this original ParaMonte library.

This software is available to the public under a highly permissive license.
Help us justify its continued development and maintenance by acknowledging its benefit to society, distributing it, and contributing to it.

Author:
Joshua Alexander Osborne, May 21 2024, 4:22 AM, University of Texas at Arlington
Fatemeh Bagheri, May 20 2024, 1:25 PM, NASA Goddard Space Flight Center (GSFC), Washington, D.C.
Amir Shahmoradi, May 16 2016, 9:03 AM, Oden Institute for Computational Engineering and Sciences (ICES), UT Austin

Member Function Documentation

◆ get()

function Cor::get ( in  self,
in  dfref,
in  method 
)

Return the correlation matrix of the input data.

This is a dynamic method of the Cor class.
This method automatically stores any input information in the corresponding components of the parent object.
However, any components of the parent object corresponding to the output of this method must be set explicitly manually.

Parameters
[in,out]self: The implicitly-passed input argument representing the parent object of the method.
[in]dfref: The input (reference of function handle returning a) MATLAB matrix or table of rank 2 containing the ncol columns of nrow data whose correlation matrix must be computed.
Ideally, the user would want to pass a reference to a dataframe (e.g., as a function handle @()df) so that the data remains dynamically up-to-date.
(optional. If missing, the correlation matrix will not be computed.)
[in]method: The input scalar MATLAB string that can be either:
  1. "pearson" : for computing the Pearson correlation matrix of the input data.
  2. "kendall" : for computing the kendall rank correlation matrix of the input data.
  3. "spearman" : for computing the Spearman rank correlation matrix of the input data.
(optional, default = "pearson")
Returns
val : The output MATLAB table containing the correlation matrix.


Possible calling interfaces

mat = pm.stats.Cor(dfref, method)
mat.val = mat.get()
mat.val = mat.get([])
mat.val = mat.get([], [])
mat.val = mat.get([], method)
mat.val = mat.get(dfref)
mat.val = mat.get(dfref, [])
mat.val = mat.get(dfref, method)
Note
See the documentation of the class constructor pm.stats.Cor for example usage.


Final Remarks


If you believe this algorithm or its documentation can be improved, we appreciate your contribution and help to edit this page's documentation and source file on GitHub.
For details on the naming abbreviations, see this page.
For details on the naming conventions, see this page.
This software is distributed under the MIT license with additional terms outlined below.

  1. If you use any parts or concepts from this library to any extent, please acknowledge the usage by citing the relevant publications of the ParaMonte library.
  2. If you regenerate any parts/ideas from this library in a programming environment other than those currently supported by this ParaMonte library (i.e., other than C, C++, Fortran, MATLAB, Python, R), please also ask the end users to cite this original ParaMonte library.

This software is available to the public under a highly permissive license.
Help us justify its continued development and maintenance by acknowledging its benefit to society, distributing it, and contributing to it.

Author:
Joshua Alexander Osborne, May 21 2024, 4:24 AM, University of Texas at Arlington
Fatemeh Bagheri, May 20 2024, 1:25 PM, NASA Goddard Space Flight Center (GSFC), Washington, D.C.
Amir Shahmoradi, May 16 2016, 9:03 AM, Oden Institute for Computational Engineering and Sciences (ICES), UT Austin

◆ setvis()

function Cor::setvis ( in  self,
in  val 
)

Set up the visualization tools of the correlation matrix.

This is a dynamic Hidden method of the pm.stats.Cor class.
This method is inaccessible to the end users of the ParaMonte MATLAB library.

Parameters
[in,out]self: The implicitly-passed input argument representing the parent object of the method.
[in]val: The input (reference of function handle returning a) MATLAB matrix or table of rank 2 containing the computed correlation matrix to be visualized.
Ideally, the user would want to pass a reference to a dataframe (e.g., as a function handle @()df) so that the data remains dynamically up-to-date.
(optional. If missing, the contents of the corresponding var attribute of the parent object will be used.)


Possible calling interfaces

mat = pm.stats.Cor(dfref, method)
mat.setvis(); % This method is automatically called within the object constructor.


Final Remarks


If you believe this algorithm or its documentation can be improved, we appreciate your contribution and help to edit this page's documentation and source file on GitHub.
For details on the naming abbreviations, see this page.
For details on the naming conventions, see this page.
This software is distributed under the MIT license with additional terms outlined below.

  1. If you use any parts or concepts from this library to any extent, please acknowledge the usage by citing the relevant publications of the ParaMonte library.
  2. If you regenerate any parts/ideas from this library in a programming environment other than those currently supported by this ParaMonte library (i.e., other than C, C++, Fortran, MATLAB, Python, R), please also ask the end users to cite this original ParaMonte library.

This software is available to the public under a highly permissive license.
Help us justify its continued development and maintenance by acknowledging its benefit to society, distributing it, and contributing to it.

Author:
Fatemeh Bagheri, May 20 2024, 1:25 PM, NASA Goddard Space Flight Center (GSFC), Washington, D.C.
Amir Shahmoradi, May 16 2016, 9:03 AM, Oden Institute for Computational Engineering and Sciences (ICES), UT Austin

The documentation for this class was generated from the following file: