This module contains classes and procedures for computing the Mahalanobis statistical distance.
More...
This module contains classes and procedures for computing the Mahalanobis statistical distance.
The Mahalanobis distance of an observation \vec{x} = (x_1, x_2, x_3, \ldots, x_N)^\mathsf{H} from a set of observations represented by a Multivariate Normal (MVN) distribution in N dimensions with (\bu{\mu}, \bu{\Sigma}) as its mean vector and covariance matrix is defined as,
\begin{equation}
\large
D_M( \vec{x} ) = \sqrt{
(\vec{x} - \bu{\mu})^\mathsf{H} ~ \bu{\Sigma}^{-1} (\vec{x} - \bu{\mu})
}~,
\end{equation}
where ^{H} stands for the Hermitian transpose.
When the Covariance of the MVN distribution is the Identity matrix, the Mahalanobis distance simply becomes the Euclidean norm.
- Benchmarks:
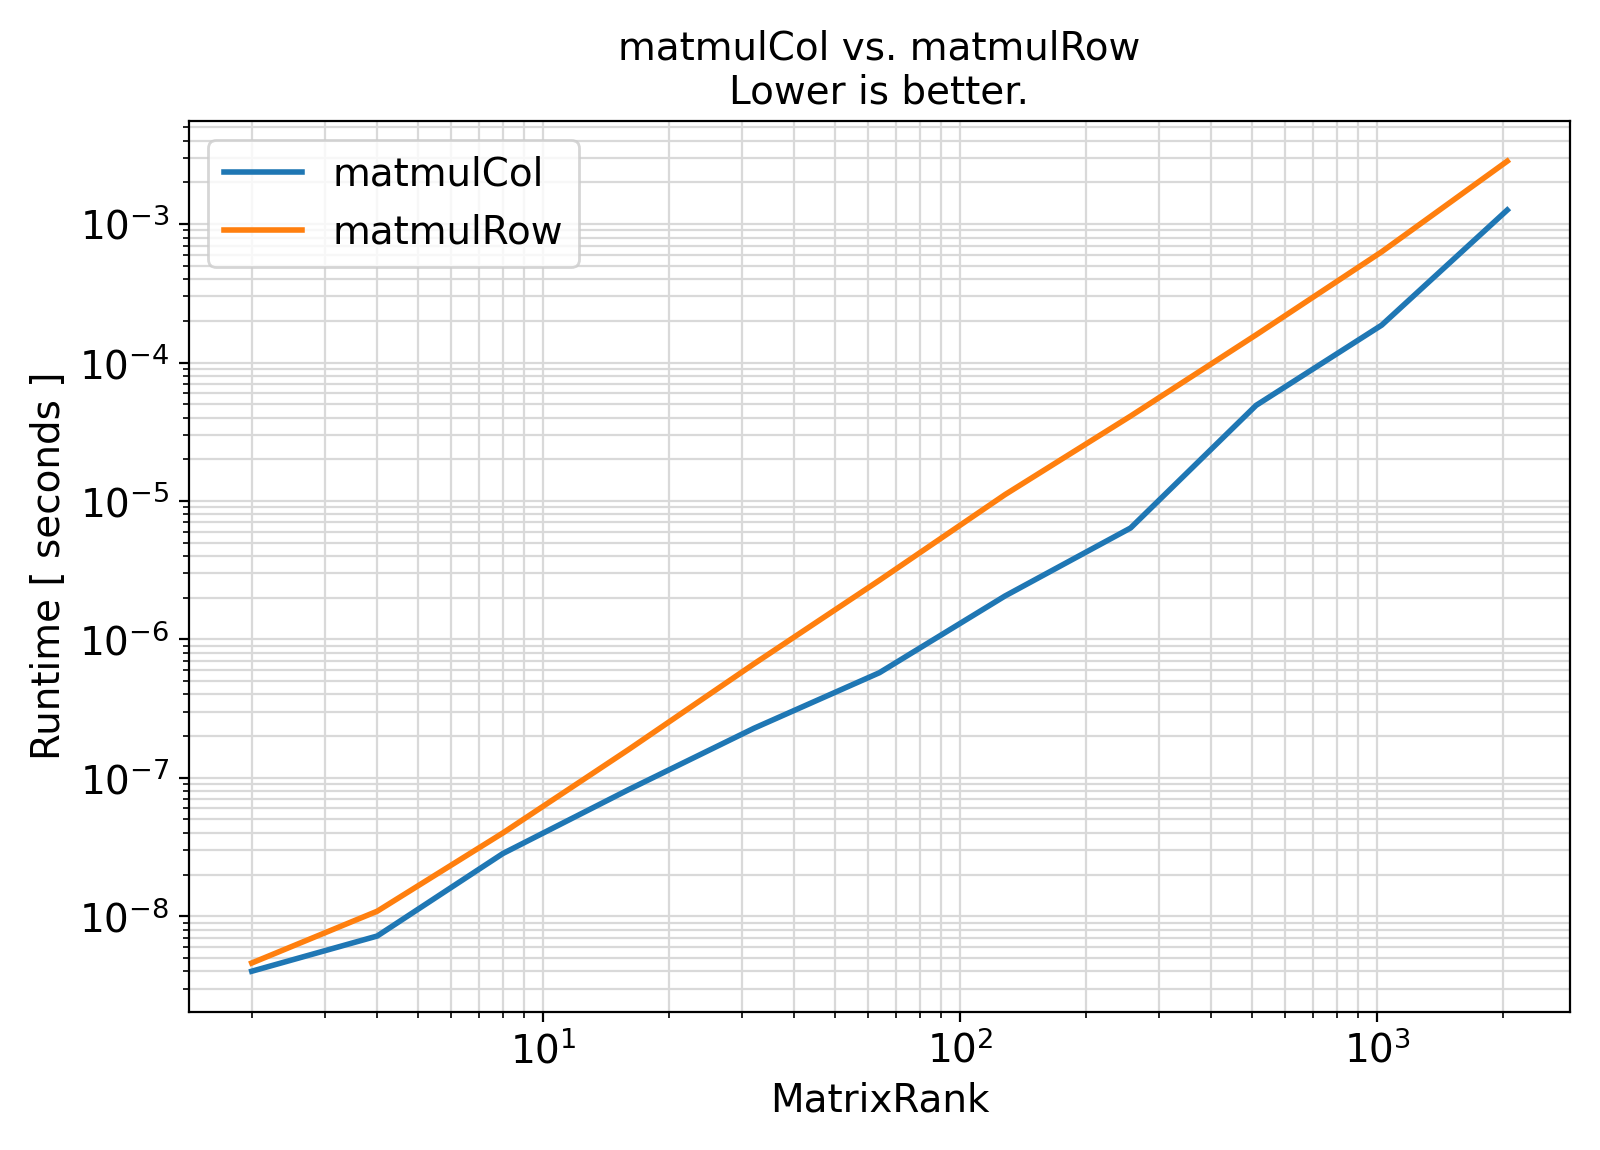
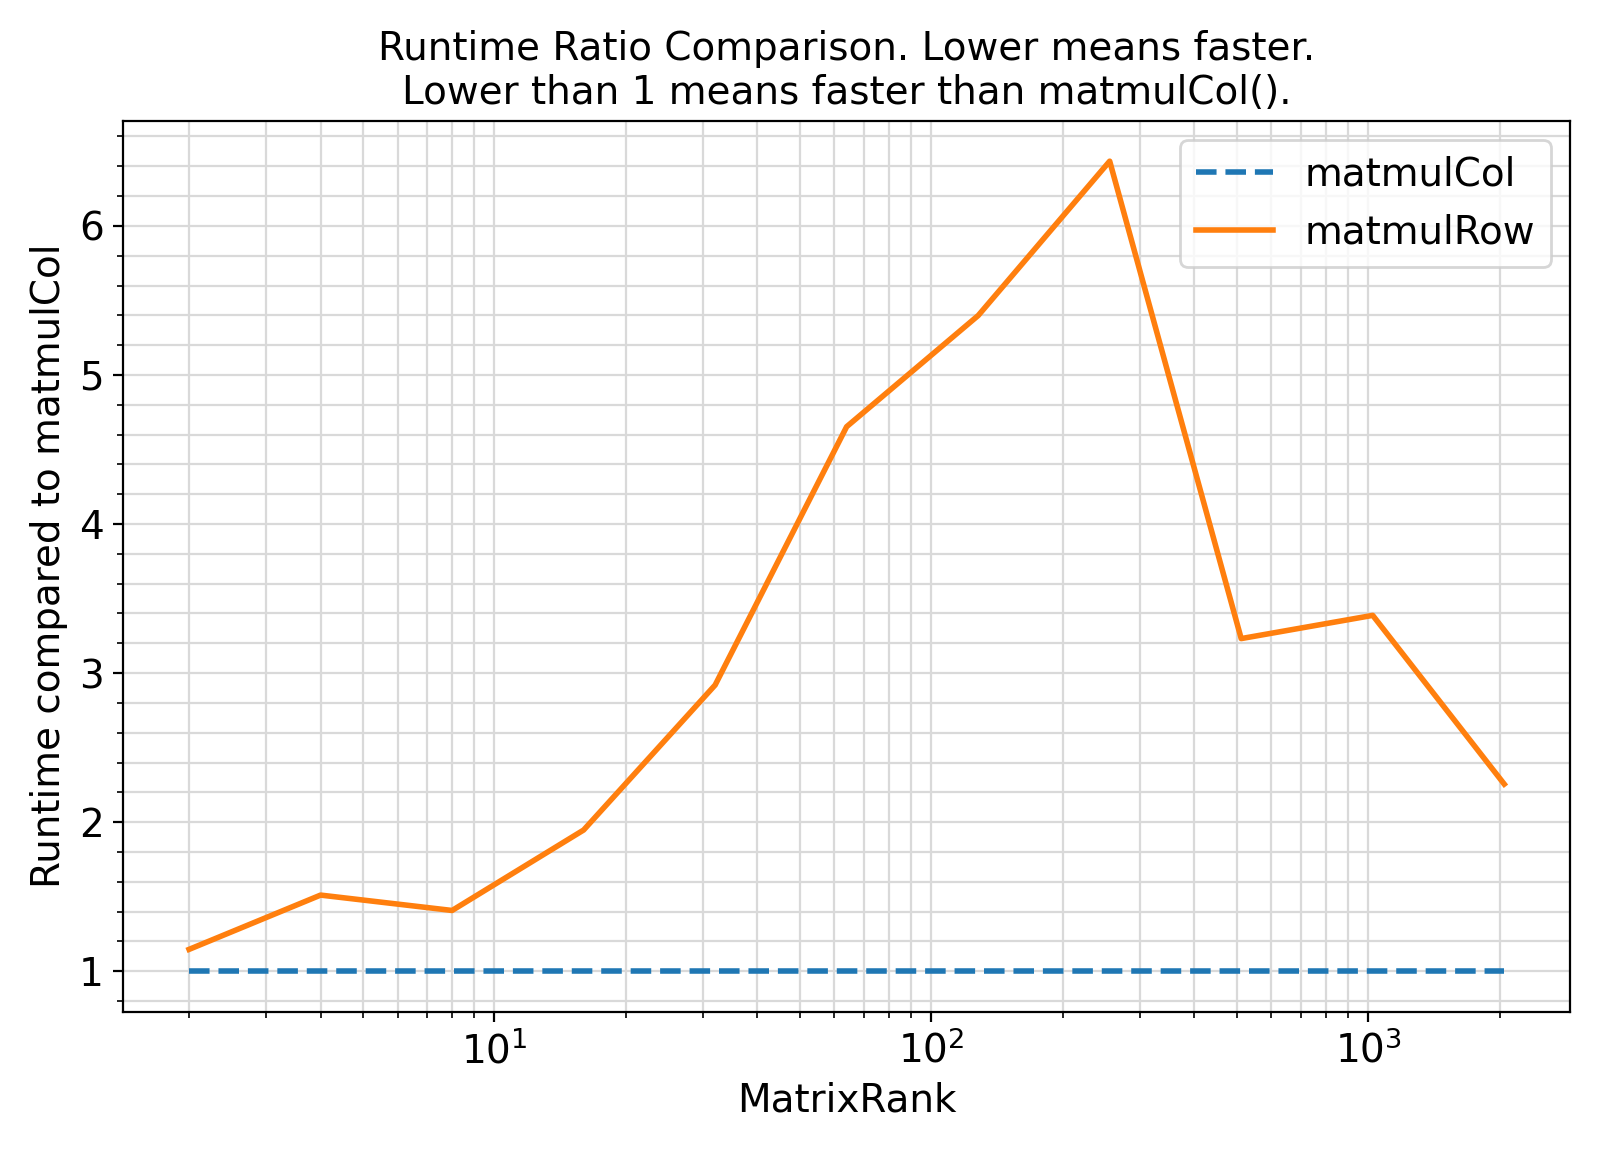
Benchmark :: The runtime performance of getDisMahalSq vs. setDisMahalSq ⛓
5 use iso_fortran_env,
only:
error_unit
12 integer(IK) :: fileUnit
13 integer(IK) :: rank, irank
14 integer(IK) ,
parameter :: NRANK
= 11_IK
15 real(RKG) :: dummySum
= 0._RKG
16 real(RKG) ,
allocatable :: matA(:,:), matB(:), matC(:), matD(:)
17 type(bench_type),
allocatable :: bench(:)
19 bench
= [
bench_type(name
= SK_
"matmulCol", exec
= matmulCol, overhead
= setOverhead)
&
20 ,
bench_type(name
= SK_
"matmulRow", exec
= matmulRow, overhead
= setOverhead)
&
23 open(newunit
= fileUnit, file
= "main.out", status
= "replace")
25 write(fileUnit,
"(*(g0,:,', '))")
"MatrixRank", (bench(i)
%name, i
= 1,
size(bench))
27 loopOverMatrixRank:
do irank
= 1, NRANK
35 write(
*,
"(*(g0,:,' '))")
"Benchmarking with rank", rank
38 bench(i)
%timing
= bench(i)
%getTiming(minsec
= 0.07_RK)
41 write(fileUnit,
"(*(g0,:,', '))") rank, (bench(i)
%timing
%mean, i
= 1,
size(bench))
43 end do loopOverMatrixRank
44 write(
*,
"(*(g0,:,' '))") dummySum
45 write(
*,
"(*(g0,:,' '))")
55 subroutine setOverhead()
60 if (
all(matD
== matC)) dummySum
= dummySum
+ matC(
1)
+ matD(
1)
63 subroutine matmulRow()
64 matC
= matmul(matA, matB)
68 subroutine matmulCol()
69 matD
= matmul(matB, matA)
Generate and return an object of type timing_type containing the benchmark timing information and sta...
Generate and return a scalar or a contiguous array of rank 1 of length s1 of randomly uniformly distr...
This module contains abstract interfaces and types that facilitate benchmarking of different procedur...
This module contains classes and procedures for computing various statistical quantities related to t...
This module defines the relevant Fortran kind type-parameters frequently used in the ParaMonte librar...
integer, parameter RK
The default real kind in the ParaMonte library: real64 in Fortran, c_double in C-Fortran Interoperati...
integer, parameter IK
The default integer kind in the ParaMonte library: int32 in Fortran, c_int32_t in C-Fortran Interoper...
integer, parameter SK
The default character kind in the ParaMonte library: kind("a") in Fortran, c_char in C-Fortran Intero...
This is the class for creating benchmark and performance-profiling objects.
Example Unix compile command via Intel ifort compiler ⛓
3ifort -fpp -standard-semantics -O3 -Wl,-rpath,../../../lib -I../../../inc main.F90 ../../../lib/libparamonte* -o main.exe
Example Windows Batch compile command via Intel ifort compiler ⛓
2set PATH=..\..\..\lib;%PATH%
3ifort /fpp /standard-semantics /O3 /I:..\..\..\include main.F90 ..\..\..\lib\libparamonte*.lib /exe:main.exe
Example Unix / MinGW compile command via GNU gfortran compiler ⛓
3gfortran -cpp -ffree-line-length-none -O3 -Wl,-rpath,../../../lib -I../../../inc main.F90 ../../../lib/libparamonte* -o main.exe
Postprocessing of the benchmark output ⛓
3import matplotlib.pyplot
as plt
8dirname = os.path.basename(os.getcwd())
12df = pd.read_csv(
"main.out", delimiter =
", ")
13colnames = list(df.columns.values)
19ax = plt.figure(figsize = 1.25 * np.array([6.4,4.6]), dpi = 200)
22for colname
in colnames[1:]:
23 plt.plot( df[colnames[0]].values
28plt.xticks(fontsize = fontsize)
29plt.yticks(fontsize = fontsize)
30ax.set_xlabel(colnames[0], fontsize = fontsize)
31ax.set_ylabel(
"Runtime [ seconds ]", fontsize = fontsize)
32ax.set_title(
" vs. ".join(colnames[1:])+
"\nLower is better.", fontsize = fontsize)
36plt.grid(visible =
True, which =
"both", axis =
"both", color =
"0.85", linestyle =
"-")
37ax.tick_params(axis =
"y", which =
"minor")
38ax.tick_params(axis =
"x", which =
"minor")
39ax.legend ( colnames[1:]
46plt.savefig(
"benchmark." + dirname +
".runtime.png")
52ax = plt.figure(figsize = 1.25 * np.array([6.4,4.6]), dpi = 200)
55plt.plot( df[colnames[0]].values
56 , np.ones(len(df[colnames[0]].values))
61for colname
in colnames[2:]:
62 plt.plot( df[colnames[0]].values
63 , df[colname].values / df[colnames[1]].values
67plt.xticks(fontsize = fontsize)
68plt.yticks(fontsize = fontsize)
69ax.set_xlabel(colnames[0], fontsize = fontsize)
70ax.set_ylabel(
"Runtime compared to {}".format(colnames[1]), fontsize = fontsize)
71ax.set_title(
"Runtime Ratio Comparison. Lower means faster.\nLower than 1 means faster than {}().".format(colnames[1]), fontsize = fontsize)
75plt.grid(visible =
True, which =
"both", axis =
"both", color =
"0.85", linestyle =
"-")
76ax.tick_params(axis =
"y", which =
"minor")
77ax.tick_params(axis =
"x", which =
"minor")
78ax.legend ( colnames[1:]
85plt.savefig(
"benchmark." + dirname +
".runtime.ratio.png")
Visualization of the benchmark output ⛓
Benchmark moral ⛓
- Fortran is a column-major language, meaning that matrix elements are stored column-wise in computer memory.
- As such, matrix multiplication format that respects column-major order of Fortran, is significantly faster than the row-major matrix multiplication.
- This is particularly relevant when one matrix is symmetric square and the other is a vector, which is the case with the procedures of the generic interface getDisMahalSq.
Benchmark :: The runtime performance of getDisMahalSq vs. setDisMahalSq ⛓
4 use iso_fortran_env,
only:
error_unit
10 integer(IK) :: fileUnit
11 integer(IK) :: i, isim, nsim
12 integer(IK) :: rank, irank
13 integer(IK) ,
parameter :: NRANK
= 10_IK
14 real(RKG) :: dummySum
= 0._RKG
15 real(RKG) :: dummyOne
= 0._RKG
16 real(RKG) :: dummyTwo
= 0._RKG
17 real(RKG) ,
allocatable :: matA(:,:), matB(:)
18 type(bench_type),
allocatable :: bench(:)
20 bench
= [
bench_type(name
= SK_
"loop_and_dotp", exec
= loop_and_dotp, overhead
= setOverhead)
&
21 ,
bench_type(name
= SK_
"dotp_matmul", exec
= dotp_matmul, overhead
= setOverhead)
&
24 open(newunit
= fileUnit, file
= "main.out", status
= "replace")
26 write(fileUnit,
"(*(g0,:,', '))")
"MatrixRank", (bench(i)
%name, i
= 1,
size(bench))
28 loopOverMatrixRank:
do irank
= 1, NRANK
31 nsim
= nint(
2.**NRANK
/ rank)
35 write(
*,
"(*(g0,:,' '))")
"Benchmarking with rank", rank
38 bench(i)
%timing
= bench(i)
%getTiming(minsec
= 0.07_RK)
41 write(fileUnit,
"(*(g0,:,', '))") rank, (bench(i)
%timing
%mean
/ nsim, i
= 1,
size(bench))
43 end do loopOverMatrixRank
44 write(
*,
"(*(g0,:,' '))") dummySum
45 write(
*,
"(*(g0,:,' '))")
55 subroutine setOverhead()
62 dummySum
= dummySum
+ dummyOne
+ dummyTwo
65 subroutine loop_and_dotp()
66 integer(IK) :: i, sizeB
67 sizeB
= size(matB,
1, IK)
71 dummyOne
= dummyOne
+ matB(i)
* dot_product(matB, matA(
1:sizeB, i))
77 subroutine dotp_matmul()
79 dummyTwo
= dot_product(matB,
matmul(matB, matA))
Example Unix compile command via Intel ifort compiler ⛓
3ifort -fpp -standard-semantics -O3 -Wl,-rpath,../../../lib -I../../../inc main.F90 ../../../lib/libparamonte* -o main.exe
Example Windows Batch compile command via Intel ifort compiler ⛓
2set PATH=..\..\..\lib;%PATH%
3ifort /fpp /standard-semantics /O3 /I:..\..\..\include main.F90 ..\..\..\lib\libparamonte*.lib /exe:main.exe
Example Unix / MinGW compile command via GNU gfortran compiler ⛓
3gfortran -cpp -ffree-line-length-none -O3 -Wl,-rpath,../../../lib -I../../../inc main.F90 ../../../lib/libparamonte* -o main.exe
Postprocessing of the benchmark output ⛓
3import matplotlib.pyplot
as plt
8dirname = os.path.basename(os.getcwd())
12df = pd.read_csv(
"main.out", delimiter =
", ")
13colnames = list(df.columns.values)
19ax = plt.figure(figsize = 1.25 * np.array([6.4,4.6]), dpi = 200)
22for colname
in colnames[1:]:
23 plt.plot( df[colnames[0]].values
28plt.xticks(fontsize = fontsize)
29plt.yticks(fontsize = fontsize)
30ax.set_xlabel(colnames[0], fontsize = fontsize)
31ax.set_ylabel(
"Runtime [ seconds ]", fontsize = fontsize)
32ax.set_title(
" vs. ".join(colnames[1:])+
"\nLower is better.", fontsize = fontsize)
36plt.grid(visible =
True, which =
"both", axis =
"both", color =
"0.85", linestyle =
"-")
37ax.tick_params(axis =
"y", which =
"minor")
38ax.tick_params(axis =
"x", which =
"minor")
39ax.legend ( colnames[1:]
46plt.savefig(
"benchmark." + dirname +
".runtime.png")
52ax = plt.figure(figsize = 1.25 * np.array([6.4,4.6]), dpi = 200)
55plt.plot( df[colnames[0]].values
56 , np.ones(len(df[colnames[0]].values))
61for colname
in colnames[2:]:
62 plt.plot( df[colnames[0]].values
63 , df[colname].values / df[colnames[1]].values
67plt.xticks(fontsize = fontsize)
68plt.yticks(fontsize = fontsize)
69ax.set_xlabel(colnames[0], fontsize = fontsize)
70ax.set_ylabel(
"Runtime compared to {}".format(colnames[1]), fontsize = fontsize)
71ax.set_title(
"Runtime Ratio Comparison. Lower means faster.\nLower than 1 means faster than {}().".format(colnames[1]), fontsize = fontsize)
75plt.grid(visible =
True, which =
"both", axis =
"both", color =
"0.85", linestyle =
"-")
76ax.tick_params(axis =
"y", which =
"minor")
77ax.tick_params(axis =
"x", which =
"minor")
78ax.legend ( colnames[1:]
85plt.savefig(
"benchmark." + dirname +
".runtime.ratio.png")
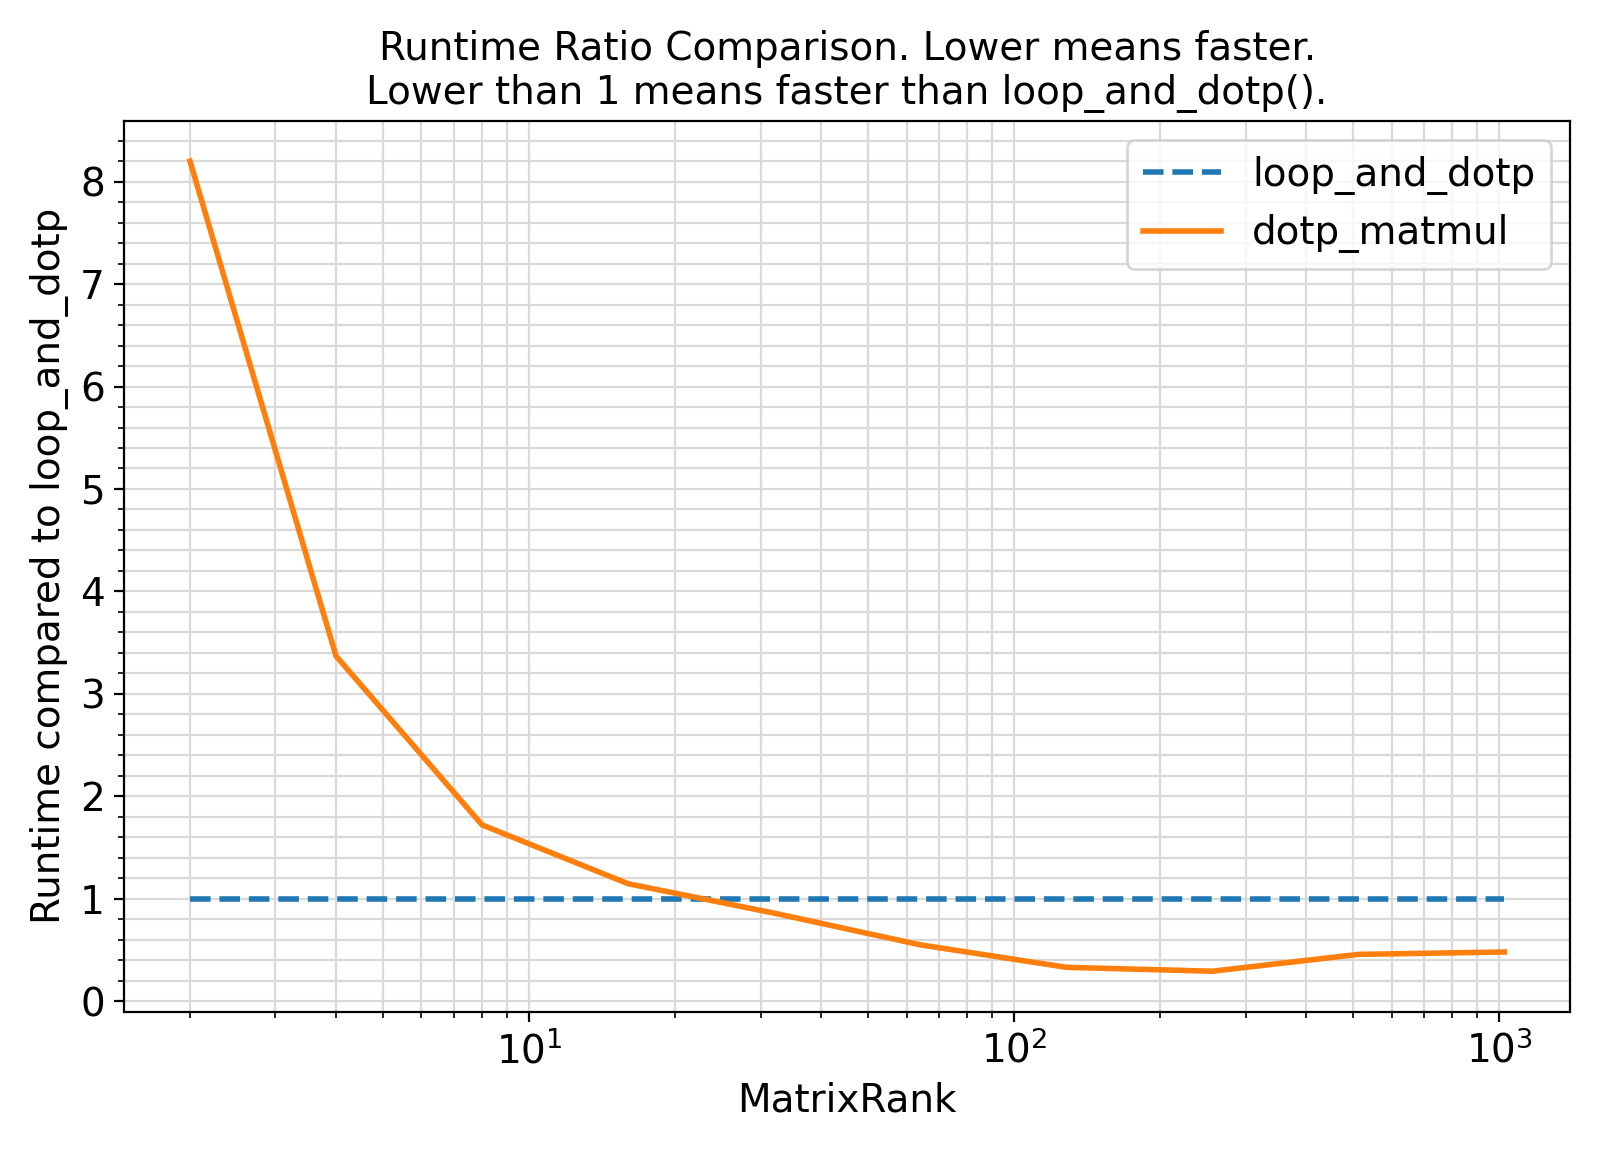
Visualization of the benchmark output ⛓
Benchmark moral ⛓
- The procedures in this benchmark compute the Mahalanobis distance using two different implementations.
-
The procedure named
loop_and_dotp computes the distance via looping and Fortran intrinsic dot_product().
This approach avoids temporary array creations.
-
The procedure named
dotp_matmul uses the all-intrinsic expression dot_product(vec, matmul(vec, mat)) to compute the distance.
- Based on the benchmark results, it appears that the looping version offers a faster implementation.
- Additionally, the specification of the slice of the matrix in the dot product of the looping approach significantly improves the performance.
- Test:
- test_pm_distanceMahal
Final Remarks ⛓
If you believe this algorithm or its documentation can be improved, we appreciate your contribution and help to edit this page's documentation and source file on GitHub.
For details on the naming abbreviations, see this page.
For details on the naming conventions, see this page.
This software is distributed under the MIT license with additional terms outlined below.
-
If you use any parts or concepts from this library to any extent, please acknowledge the usage by citing the relevant publications of the ParaMonte library.
-
If you regenerate any parts/ideas from this library in a programming environment other than those currently supported by this ParaMonte library (i.e., other than C, C++, Fortran, MATLAB, Python, R), please also ask the end users to cite this original ParaMonte library.
This software is available to the public under a highly permissive license.
Help us justify its continued development and maintenance by acknowledging its benefit to society, distributing it, and contributing to it.
- Copyright
- Computational Data Science Lab
- Author:
- Amir Shahmoradi, March 22, 2012, 2:21 PM, National Institute for Fusion Studies, The University of Texas Austin


