|
|
ParaMonte MATLAB 3.0.0
Parallel Monte Carlo and Machine Learning Library
See the latest version documentation. |
|
|
ParaMonte MATLAB 3.0.0
Parallel Monte Carlo and Machine Learning Library
See the latest version documentation. |

This is the base class for generating instances of figures containing a square symmetric tiling of subplots.
More...

Public Member Functions | |
| function | Triplex (in lower, in diago, in upper, in varargin) |
| Construct and return an object of class pm.vis.Triplex. More... | |
| function | reset (in self, in varargin) |
| Reset the properties of the figure to the original default settings. More... | |
| function | premake (in self, in varargin) |
| Preset the tiling settings before making it. More... | |
| function | make (in self, in varargin) |
| Configure the figure settings and specifications, make the figure and the subplots, and return nothing. More... | |
| function | rotateAxesLabels (in self, in degx, in degy) |
| Rotate the axes labels of the subplots of the Triplex, and return nothing. More... | |
| function | setAxesLimits (in self, in limits) |
| Set the axes x-y limits of the subplots that are currently present in the GridPlot to the input user-provided values. More... | |
| function | hideShowAxesLabels (in self) |
| Hide or show axis labels and ticks depending on the presence of the neighbor subplots. More... | |
| function | setDiagoTicksY (in self) |
| Hide or show axis labels and ticks depending on the presence of the neighbor subplots. More... | |
Data Fields | |
| Property | layout |
| Property | diago |
| Property | lower |
| Property | upper |
| Property | tile |
| Property | diagYTick |
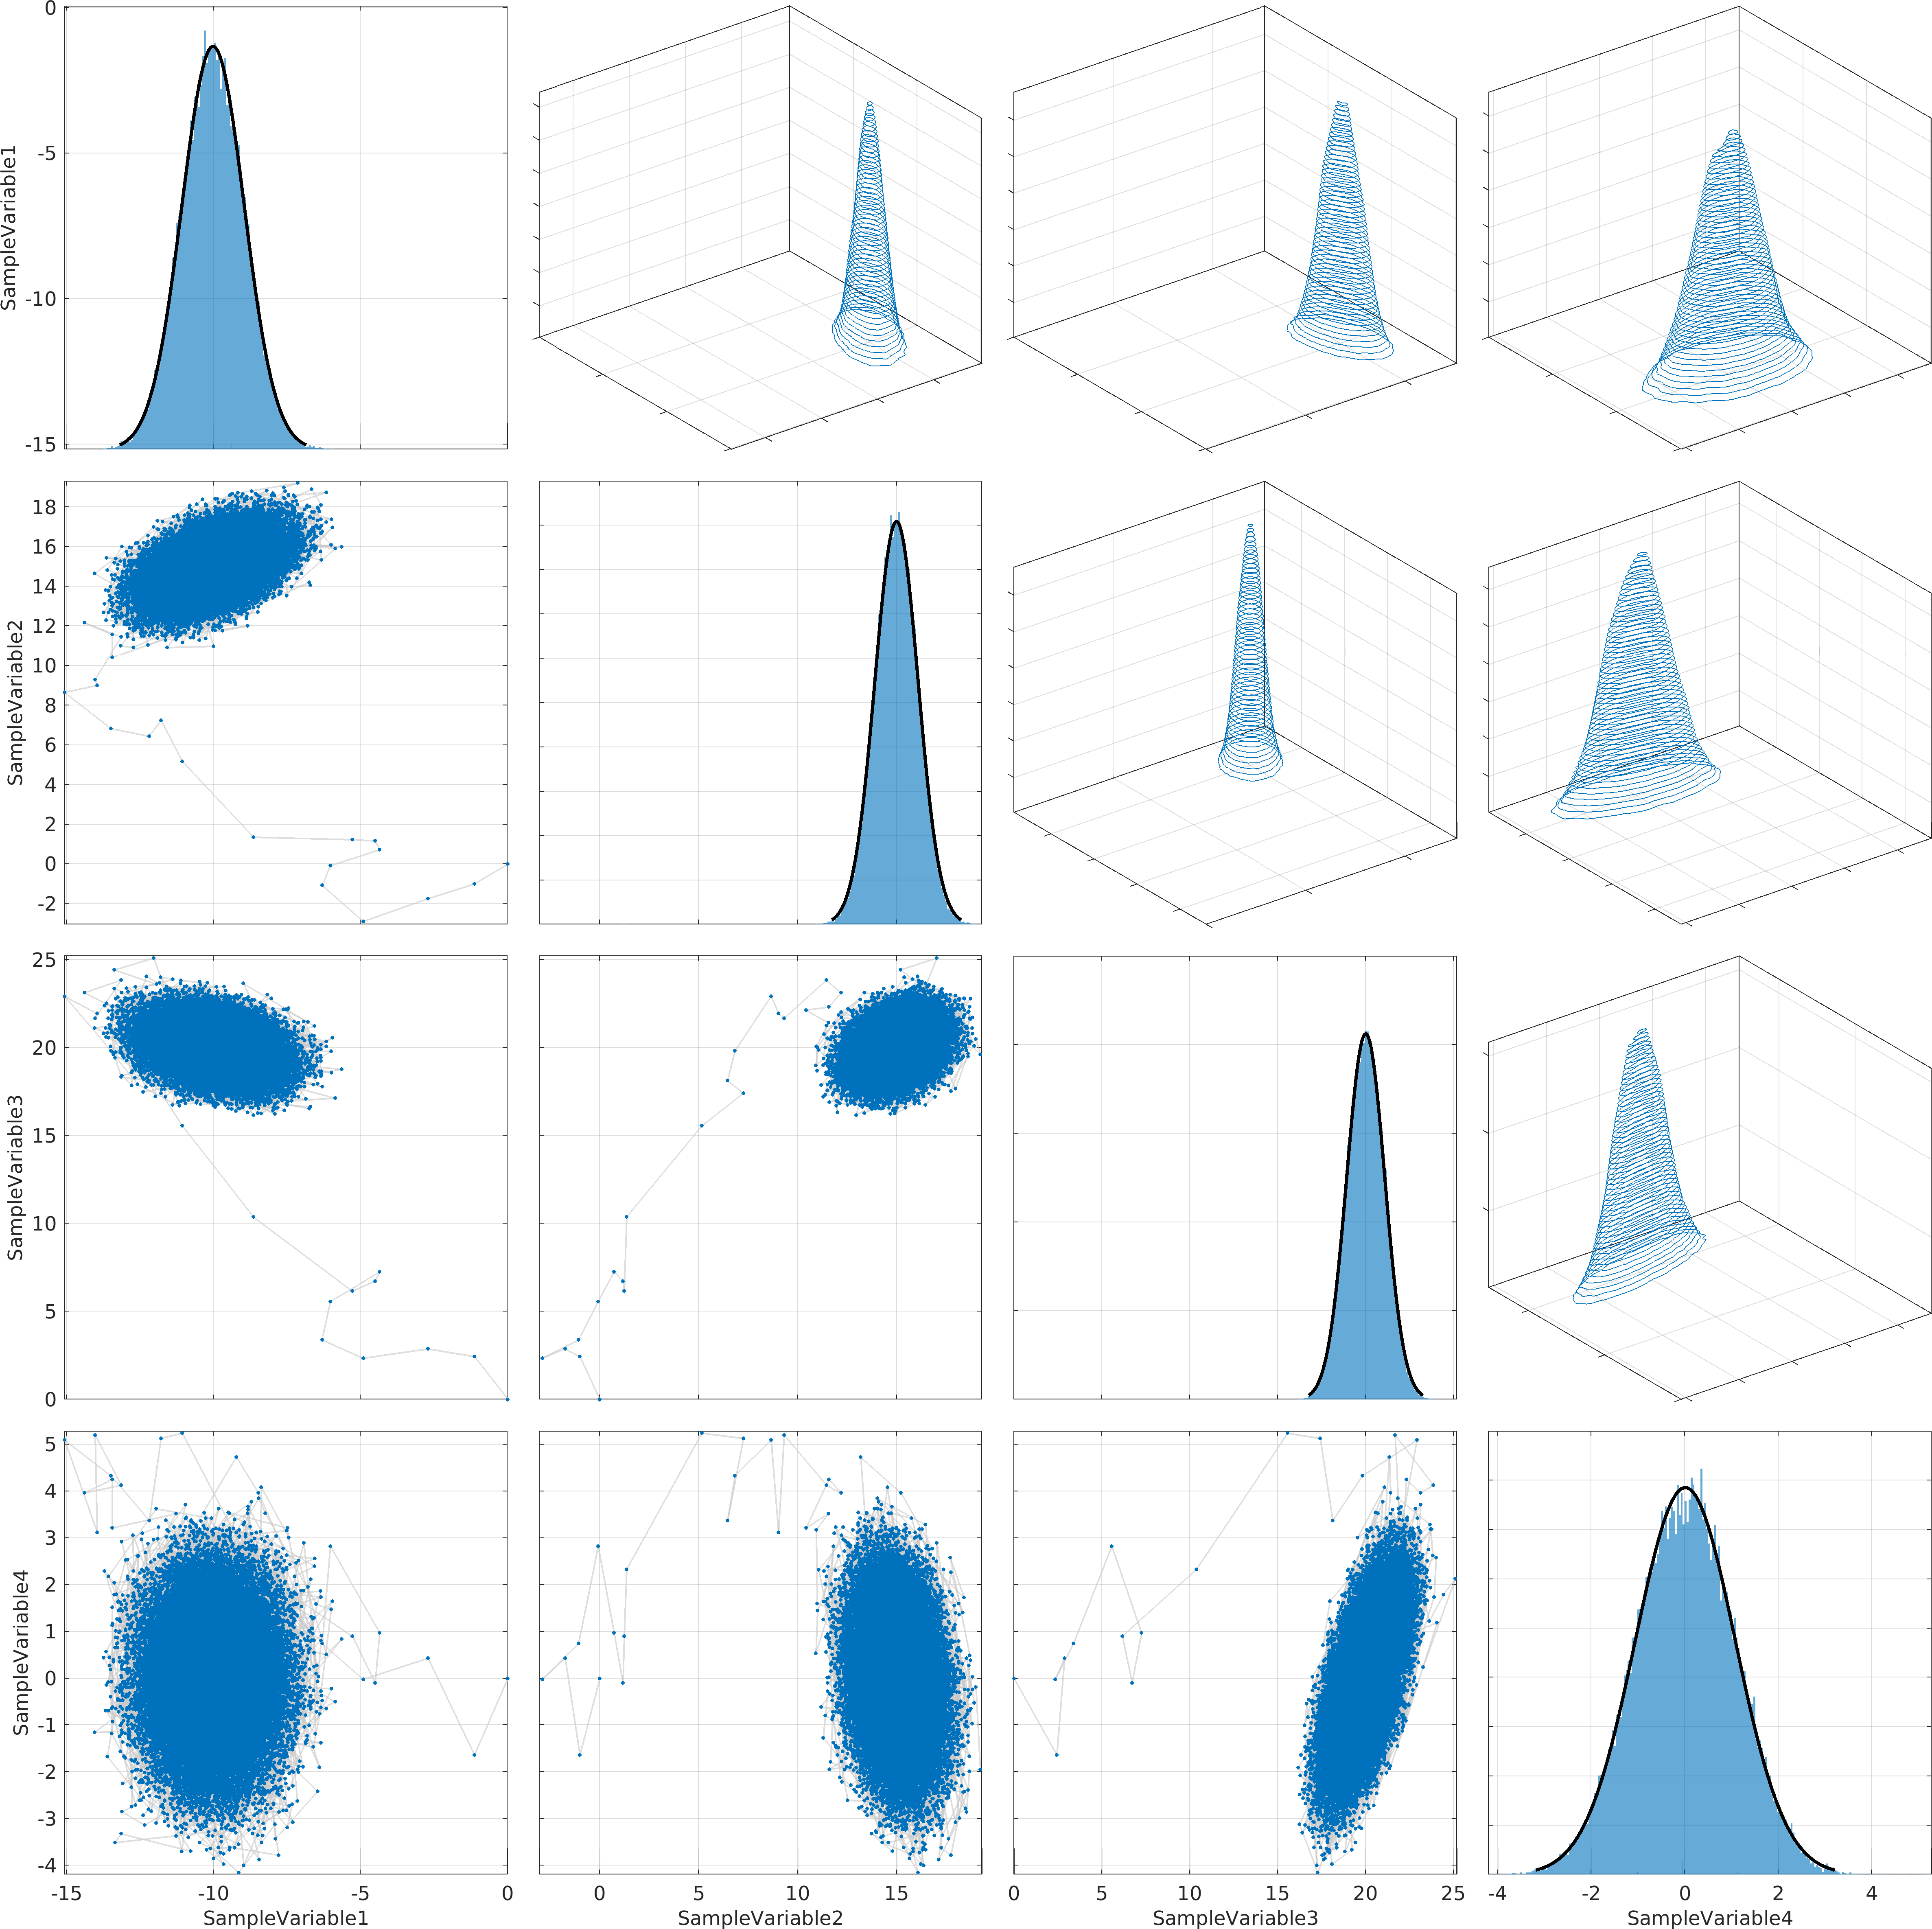
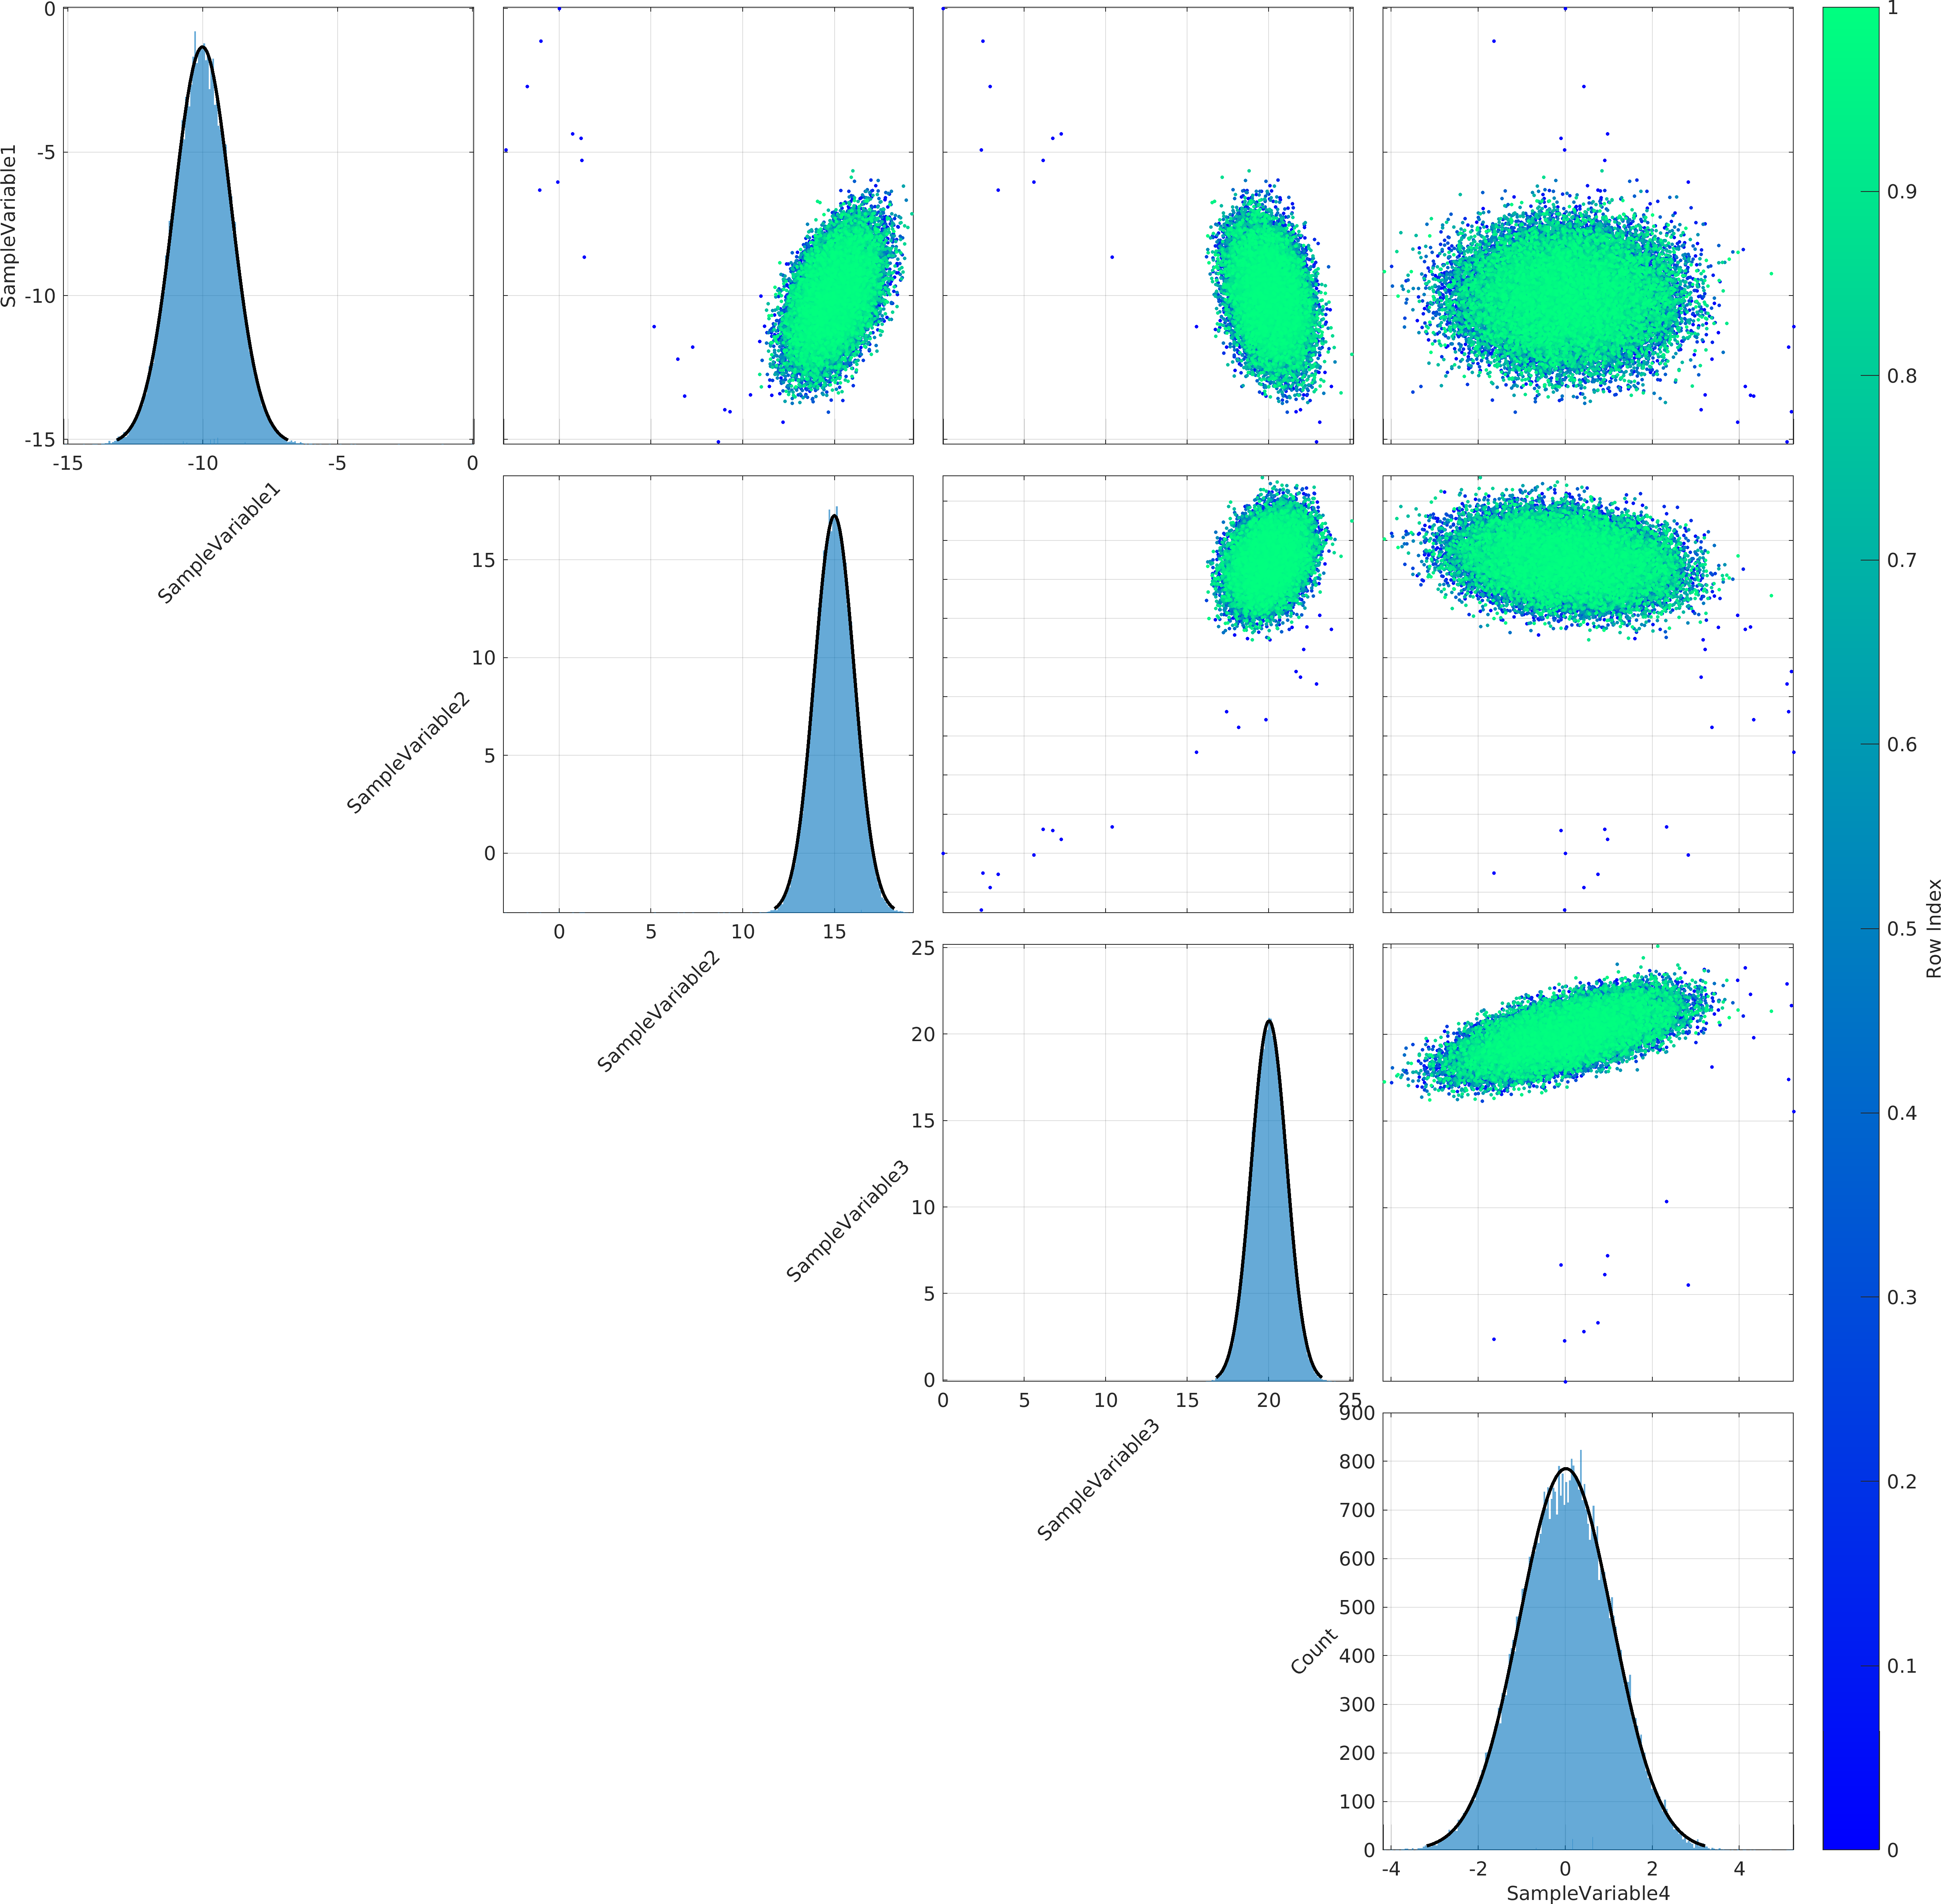
This is the base class for generating instances of figures containing a square symmetric tiling of subplots.
This class generates figures containing three types of plots in the upper-triangle, lower-triangle, and diagonal subplots of the figure.
For more information, see the documentation of the class constructor pm.vis.Triplex.Triplex.
hideShow() method of this class still has unresolved bugs that lead to missing X and Y axes labels and tick marks.show() and hide() class methods are also unavailable until the issues are resolved.
Final Remarks ⛓
If you believe this algorithm or its documentation can be improved, we appreciate your contribution and help to edit this page's documentation and source file on GitHub.
For details on the naming abbreviations, see this page.
For details on the naming conventions, see this page.
This software is distributed under the MIT license with additional terms outlined below.
This software is available to the public under a highly permissive license.
Help us justify its continued development and maintenance by acknowledging its benefit to society, distributing it, and contributing to it.
| function Triplex::Triplex | ( | in | lower, |
| in | diago, | ||
| in | upper, | ||
| in | varargin | ||
| ) |
Construct and return an object of class pm.vis.Triplex.
This is the constructor of the class pm.vis.Triplex.
The input dataset to each plot section is assumed to be common among all plots (though not necessarily).
As such, all axes labels and tick marks of all subplots are dropped by default, except for subplots in the left and bottom boundaries of the figure.
If any of the three input subplot types has colorbar, it is disabled for individual subplots.
Instead, universal colorbar(s) will be added to the right and top sides of the Triplex plot.
| [in] | lower | : The input scalar MATLAB object of superclass pm.vis.Subplot containing information for the kind the subplot that must be added to the lower-triangular elements of the Triplex matrix of subplots. (optional, default = []. If empty, no lower-triangular subplots will be visualized.) |
| [in] | diago | : The input scalar MATLAB object of superclass pm.vis.Subplot containing information for the kind the subplot that must be added to the diagonal elements of the Triplex matrix of subplots. (optional, default = []. If empty, no diagonal subplots will be visualized.) |
| [in] | upper | : The input scalar MATLAB object of superclass pm.vis.Subplot containing information for the kind the subplot that must be added to the upper-triangular elements of the Triplex matrix of subplots. (optional, default = []. If empty, no upper-triangular subplots will be visualized.) |
| [in] | varargin | : Any property, value pair of the parent object.If the property is a struct(), then its value must be given as a cell array, with consecutive elements representing the struct property-name, property-value pairs.Note that all of these property-value pairs can be also directly set via the parent object attributes, before calling the make() method. |
self : The output scalar object of class pm.vis.Triplex.
Possible calling interfaces ⛓
Example usage ⛓

Final Remarks ⛓
If you believe this algorithm or its documentation can be improved, we appreciate your contribution and help to edit this page's documentation and source file on GitHub.
For details on the naming abbreviations, see this page.
For details on the naming conventions, see this page.
This software is distributed under the MIT license with additional terms outlined below.
This software is available to the public under a highly permissive license.
Help us justify its continued development and maintenance by acknowledging its benefit to society, distributing it, and contributing to it.
| function Triplex::hideShowAxesLabels | ( | in | self | ) |
Hide or show axis labels and ticks depending on the presence of the neighbor subplots.
This is an internal (hidden) method of the class and inaccessible to end users.
| [in] | self | : The implicitly-passed input argument representing the parent object of the method. |
Possible calling interfaces ⛓
Final Remarks ⛓
If you believe this algorithm or its documentation can be improved, we appreciate your contribution and help to edit this page's documentation and source file on GitHub.
For details on the naming abbreviations, see this page.
For details on the naming conventions, see this page.
This software is distributed under the MIT license with additional terms outlined below.
This software is available to the public under a highly permissive license.
Help us justify its continued development and maintenance by acknowledging its benefit to society, distributing it, and contributing to it.
| function Triplex::make | ( | in | self, |
| in | varargin | ||
| ) |
Configure the figure settings and specifications, make the figure and the subplots, and return nothing.
The subplots are made by calling their make() methods.
| [in] | self | : The implicitly-passed input argument representing the parent object of the method. |
| [in] | varargin | : Any property, value pair of the parent object.If the property is a struct(), then its value must be given as a cell array, with consecutive elements representing the struct property-name, property-value pairs.Note that all of these property-value pairs can be also directly set via the parent object attributes, before calling the make() method. |
Possible calling interfaces ⛓
Final Remarks ⛓
If you believe this algorithm or its documentation can be improved, we appreciate your contribution and help to edit this page's documentation and source file on GitHub.
For details on the naming abbreviations, see this page.
For details on the naming conventions, see this page.
This software is distributed under the MIT license with additional terms outlined below.
This software is available to the public under a highly permissive license.
Help us justify its continued development and maintenance by acknowledging its benefit to society, distributing it, and contributing to it.
| function Triplex::premake | ( | in | self, |
| in | varargin | ||
| ) |
Preset the tiling settings before making it.
| [in] | self | : The implicitly-passed input argument representing the parent object of the method. |
| [in] | varargin | : Any property, value pair of the parent object.If the property is a struct(), then its value must be given as a cell array, with consecutive elements representing the struct property-name, property-value pairs.Note that all of these property-value pairs can be also directly set via the parent object attributes, before calling the make() method. |
Possible calling interfaces ⛓
Final Remarks ⛓
If you believe this algorithm or its documentation can be improved, we appreciate your contribution and help to edit this page's documentation and source file on GitHub.
For details on the naming abbreviations, see this page.
For details on the naming conventions, see this page.
This software is distributed under the MIT license with additional terms outlined below.
This software is available to the public under a highly permissive license.
Help us justify its continued development and maintenance by acknowledging its benefit to society, distributing it, and contributing to it.
| function Triplex::reset | ( | in | self, |
| in | varargin | ||
| ) |
Reset the properties of the figure to the original default settings.
Use this method when you change many attributes of the plot and you want to clean up and go back to the default settings.
| [in] | self | : The implicitly-passed input argument representing the parent object of the method. |
| [in] | varargin | : Any property, value pair of the parent object.If the property is a struct(), then its value must be given as a cell array, with consecutive elements representing the struct property-name, property-value pairs.Note that all of these property-value pairs can be also directly set via the parent object attributes, before calling the make() method. |
Possible calling interfaces ⛓
Final Remarks ⛓
If you believe this algorithm or its documentation can be improved, we appreciate your contribution and help to edit this page's documentation and source file on GitHub.
For details on the naming abbreviations, see this page.
For details on the naming conventions, see this page.
This software is distributed under the MIT license with additional terms outlined below.
This software is available to the public under a highly permissive license.
Help us justify its continued development and maintenance by acknowledging its benefit to society, distributing it, and contributing to it.
| function Triplex::rotateAxesLabels | ( | in | self, |
| in | degx, | ||
| in | degy | ||
| ) |
Rotate the axes labels of the subplots of the Triplex, and return nothing.
All axes labels in the tiling will be impacted by this routine, even though only a selected subset might be visible.
| [in] | self | : The implicitly-passed input argument representing the parent object of the method. |
| [in] | degx | : The input scalar MATLAB positive whole-number, representing the amount of rotation to be applied to the x-axis labels with respect to the horizontal line. If it is set to empty [], the axis label orientation will remain intact.(optional, default = 45. It must be present if and only if degy is also present.) |
| [in] | degy | : The input scalar MATLAB positive whole-number, representing the amount of rotation to be applied to the y-axis labels with respect to the horizontal line. If it is set to empty [], the axis label orientation will remain intact.(optional, default = 45. It must be present if and only if degx is also present.) |
Possible calling interfaces ⛓
Final Remarks ⛓
If you believe this algorithm or its documentation can be improved, we appreciate your contribution and help to edit this page's documentation and source file on GitHub.
For details on the naming abbreviations, see this page.
For details on the naming conventions, see this page.
This software is distributed under the MIT license with additional terms outlined below.
This software is available to the public under a highly permissive license.
Help us justify its continued development and maintenance by acknowledging its benefit to society, distributing it, and contributing to it.
| function Triplex::setAxesLimits | ( | in | self, |
| in | limits | ||
| ) |
Set the axes x-y limits of the subplots that are currently present in the GridPlot to the input user-provided values.
| [in] | self | : The implicitly-passed input argument representing the parent object of the method. |
| [in] | limits | : A MATLAB cell vector of maximum length max(size(self.tile)), each element of which corresponds to one row of the Triplex plot, from the top-left corner.Each element of the cell array must be a real vector of length 2 whose values determine the lower and upper limits of the vertical axis of the corresponding subplot in the visualization.The the axes limits of all subplots whose corresponding elements in the input cell array limits are set to empty [], will be set to the appropriate default value taken from the maximum range possible in the relevant plots.(optional, default = cell(max(size(self.tile)), 1)) |
Possible calling interfaces ⛓
Example usage ⛓
Final Remarks ⛓
If you believe this algorithm or its documentation can be improved, we appreciate your contribution and help to edit this page's documentation and source file on GitHub.
For details on the naming abbreviations, see this page.
For details on the naming conventions, see this page.
This software is distributed under the MIT license with additional terms outlined below.
This software is available to the public under a highly permissive license.
Help us justify its continued development and maintenance by acknowledging its benefit to society, distributing it, and contributing to it.
| function Triplex::setDiagoTicksY | ( | in | self | ) |
Hide or show axis labels and ticks depending on the presence of the neighbor subplots.
This is an internal (hidden) method of the class and inaccessible to end users.
| [in] | self | : The implicitly-passed input argument representing the parent object of the method. |
Possible calling interfaces ⛓
Final Remarks ⛓
If you believe this algorithm or its documentation can be improved, we appreciate your contribution and help to edit this page's documentation and source file on GitHub.
For details on the naming abbreviations, see this page.
For details on the naming conventions, see this page.
This software is distributed under the MIT license with additional terms outlined below.
This software is available to the public under a highly permissive license.
Help us justify its continued development and maintenance by acknowledging its benefit to society, distributing it, and contributing to it.
| Property Triplex::diago |
diago
The scalar object of superclass pm.vis.Subplot representing the template of the diagonal subplots to display.
Note that only the visualization properties of the template are used.
The data properties of the template are set by the make() method.
(optional. The default value is pm.vis.SubplotHistogram.)
| Property Triplex::diagYTick |
| Property Triplex::layout |
layout
The scalar object of class pm.vis.TilingLayout containing the default layout of the Triplex plot.
The information includes the subplots and colorbar positions.
This information is applied only to figure components whose positions are unset.
| Property Triplex::lower |
lower
The scalar object of superclass pm.vis.Subplot representing the template of the lower-triangle subplots to display.
The data properties of the template are set by the make() method.
(optional. The default value is pm.vis.SubplotContour.)
| Property Triplex::tile |
tile
The MATLAB cell matrix containing objects of superclass pm.vis.Subplot each of which represents one tile (subplot) axes to display in the figure.
| Property Triplex::upper |
upper
The scalar object of superclass pm.vis.Subplot representing the template of the upper-triangle subplots to display.
The data properties of the template are set by the make() method.
(optional. The default value is pm.vis.SubplotLineScatter.)

