ParaMonte MATLAB 3.0.0
Parallel Monte Carlo and Machine Learning Library
See the latest version documentation.
getLogPDF.m File Reference

Go to the source code of this file.

Functions

function getLogPDF (in x, in mean, in invcov)
 Return the corresponding natural logarithm(s) of Probability Density Function (PDF) of the input ndim-dimensional multivariate Normal random vector(s).
More...
 

Function Documentation

◆ getLogPDF()

function getLogPDF ( in  x,
in  mean,
in  invcov 
)

Return the corresponding natural logarithm(s) of Probability Density Function (PDF) of the input ndim-dimensional multivariate Normal random vector(s).

This log-PDF function can be potentially faster and more flexible than the intrinsic MATLAB equivalent because it optionally accepts vectors of MVN random variates and returns the natural logarithm of the density function which avoids a costly exponentiation.

Parameters
[in]x: The input vector of shape [ndim, nvec] of MATLAB real, representing the set of nvec MVN vectors from the ndim-dimensional MVN space.
[in]mean: The input vector of shape [ndim, 1] of MATLAB real, representing the mean of a Multivariate Normal distribution in size(mean) dimensional space.
If the input value is empty, it is set to the default value.
(optional. default = zeros(ndim, 1).)
[in]invcov: The input positive-definite square matrix of shape [ndim, ndim] of MATLAB real, representing the inverse of the covariance matrix of the target Multivariate Normal distribution in numel(mean) dimensional space.
If the input value is empty, it is set to the default value.
Note that the inverse covariance matrix can be readily obtained from its lower or upper Cholesky factorization (cholow or choupp) via pm.matlab.inv(cholow) or pm.matlab.inv(choupp').
(optional. default = eye(ndim, ndim).)
Returns
logPDF : The output column vector of MATLAB real of shape [nvec, 1] containing the natural logarithm(s) of the input MVN vector(s).


Possible calling interfaces

logPDF = pm.stats.dist.mvn.getLogPDF(x)
logPDF = pm.stats.dist.mvn.getLogPDF(x, mean)
logPDF = pm.stats.dist.mvn.getLogPDF(x, [], invcov)
logPDF = pm.stats.dist.mvn.getLogPDF(x, mean, invcov)


Example usage

1cd(fileparts(mfilename('fullpath'))); % Change working directory to source code directory.
2addpath('../../../../../'); % Add the ParaMonte library root directory to the search path.
3
4pm.matlab.show()
5pm.matlab.show("pdf = exp(pm.stats.dist.mvn.getLogPDF([1, 2, 3]'))")
6 pdf = exp(pm.stats.dist.mvn.getLogPDF([1, 2, 3]'))
7pm.matlab.show("pdf_ref = mvnpdf([1, 2, 3]')")
8 pdf_ref = mvnpdf([1, 2, 3]')
9assert(abs(pdf - pdf_ref) < 1.e-12)
10
11pm.matlab.show()
12pm.matlab.show('mean = [-3, 3]; cholow = chol([1 -.9; -.9, 1], "lower")')
13 mean = [-3, 3]; cholow = chol([1 -.9; -.9, 1], "lower");
14pm.matlab.show('sample = pm.stats.dist.mvn.getRand(mean, cholow, 1000);')
15 sample = pm.stats.dist.mvn.getRand(mean, cholow, 1000);
16pm.matlab.show("sample = array2table([sample', exp(pm.stats.dist.mvn.getLogPDF(sample, mean, pm.matrix.inv(cholow)))]);")
17 sample = array2table([sample', exp(pm.stats.dist.mvn.getLogPDF(sample, mean, pm.matrix.inv(cholow)))]);
18pm.matlab.show('sample.Properties.VariableNames = ["X", "Y", "MVN PDF"];')
19 sample.Properties.VariableNames = ["X", "Y", "MVN PDF"];
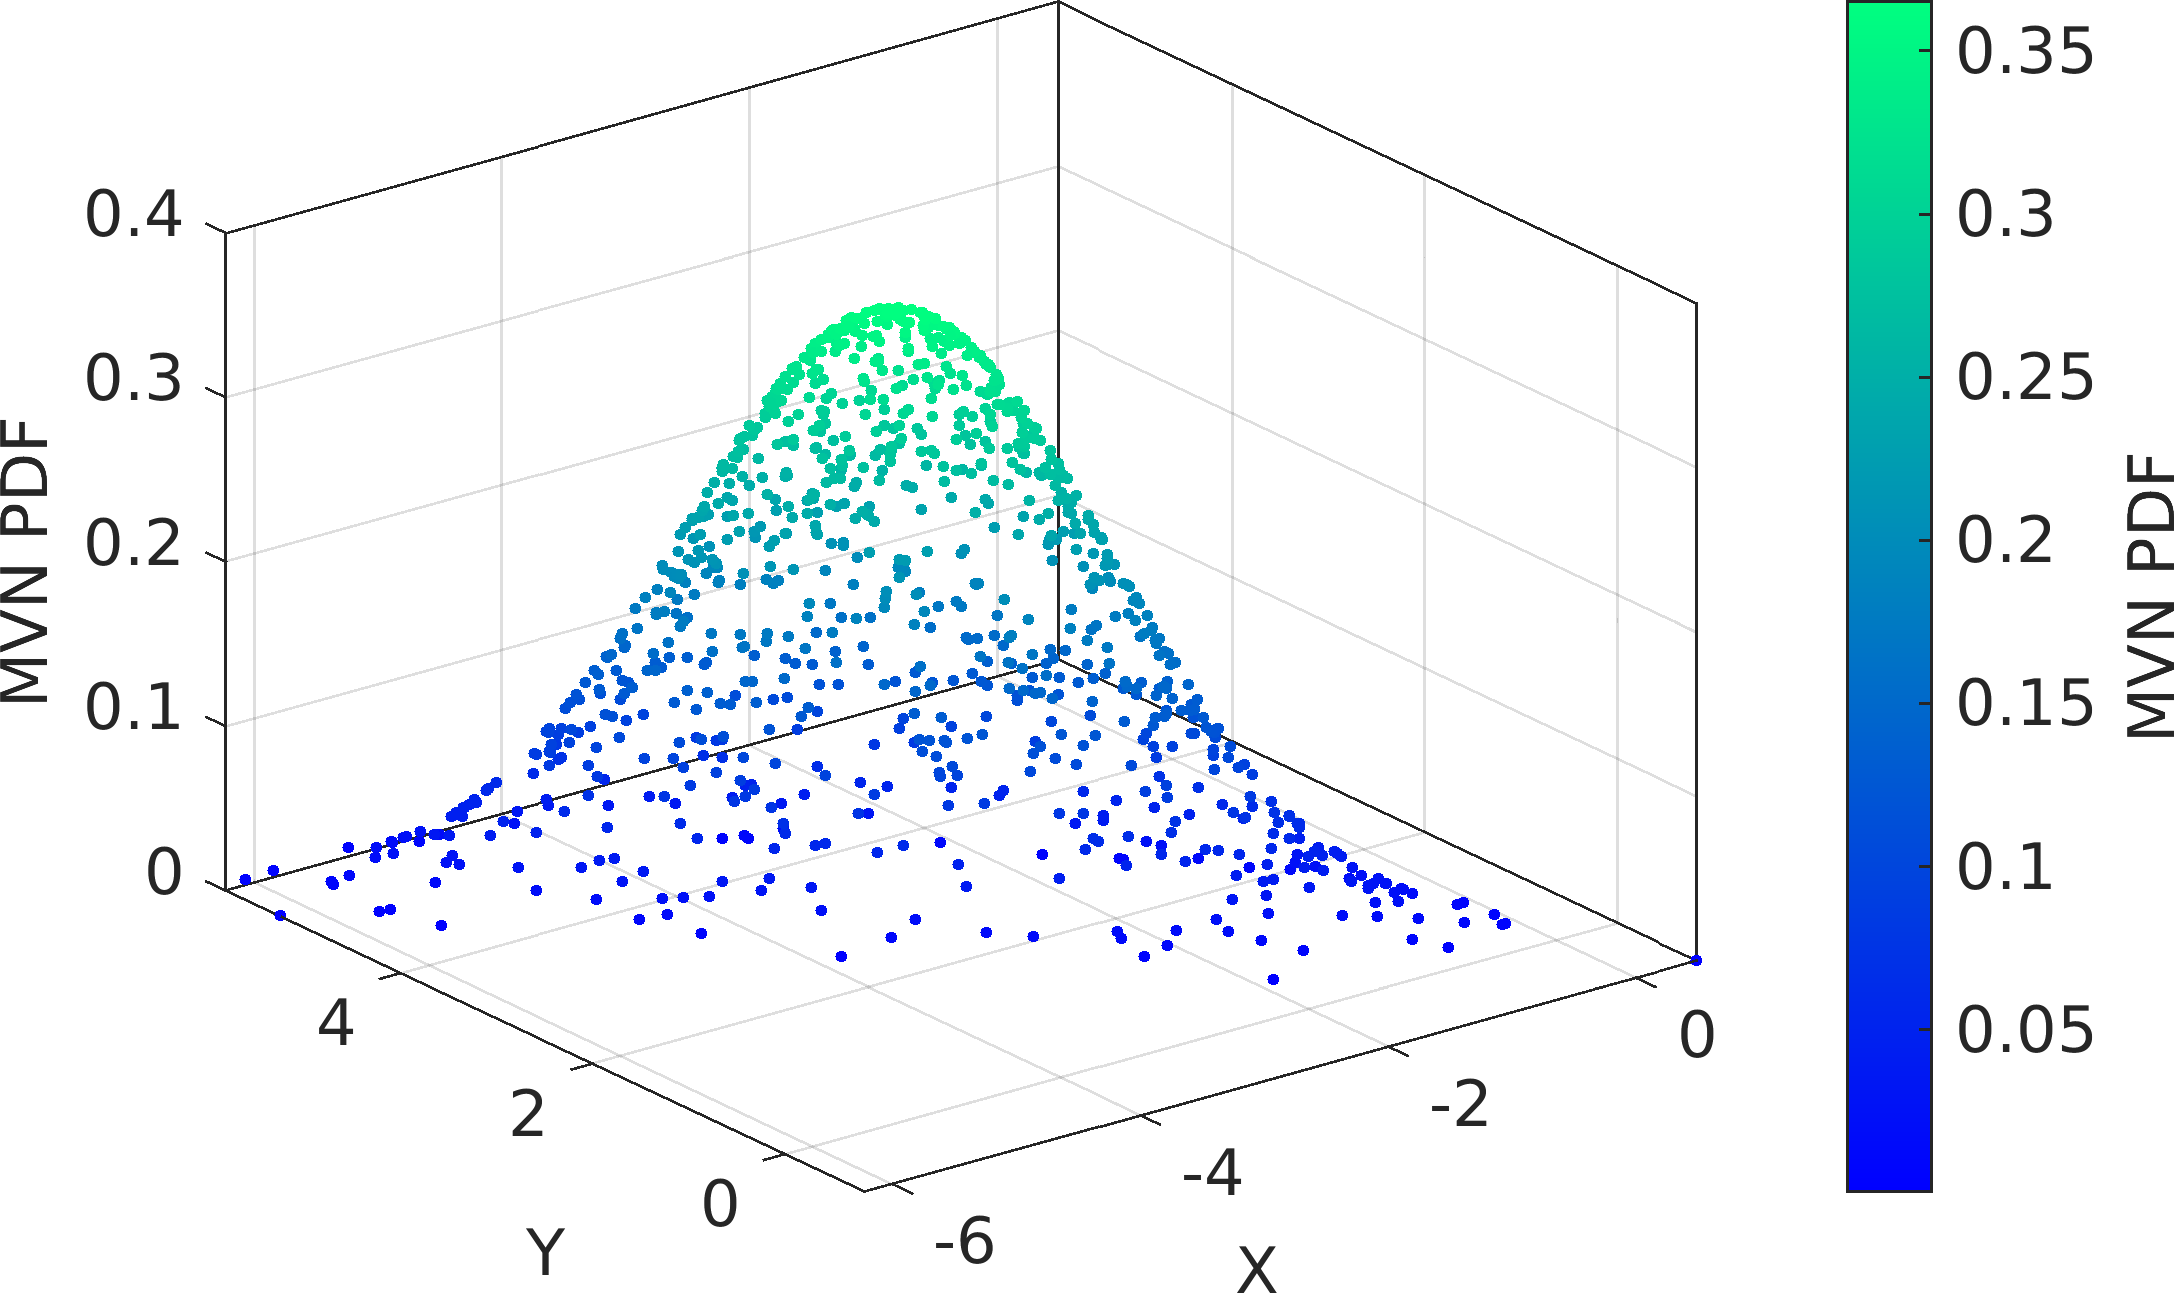
20pm.matlab.show('p = pm.vis.PlotScatter3(sample, "colx", 1, "coly", 2, "colz", 3, "colc", 3); p.make();')
21 p = pm.vis.PlotScatter3(sample, "colx", 1, "coly", 2, "colz", 3, "colc", 3); p.make();
22pm.matlab.show('pm.vis.figure.savefig("mvn.getLogPDF.scatter.3d.png", "-m4");')
23 pm.vis.figure.savefig("mvn.getLogPDF.scatter.3d.png", "-m4");
function root()
Return a scalar MATLAB string containing the root directory of the ParaMonte library package.

Example output
1
2pdf = exp(pm.stats.dist.mvn.getLogPDF([1, 2, 3]'))
3pdf =
4 5.789870153591850e-05
5pdf_ref = mvnpdf([1, 2, 3]')
6pdf_ref =
7 5.789870153591850e-05
8
9mean = [-3, 3]; cholow = chol([1 -.9; -.9, 1], "lower")
10sample = pm.stats.dist.mvn.getRand(mean, cholow, 1000);
11sample = array2table([sample', exp(pm.stats.dist.mvn.getLogPDF(sample, mean, pm.matrix.inv(cholow)))]);
12sample.Properties.VariableNames = ["X", "Y", "MVN PDF"];
13p = pm.vis.PlotScatter3(sample, "colx", 1, "coly", 2, "colz", 3, "colc", 3); p.make();
14pm.vis.figure.savefig("mvn.getLogPDF.scatter.3d.png", "-m4");

Visualization of the example output


Final Remarks


If you believe this algorithm or its documentation can be improved, we appreciate your contribution and help to edit this page's documentation and source file on GitHub.
For details on the naming abbreviations, see this page.
For details on the naming conventions, see this page.
This software is distributed under the MIT license with additional terms outlined below.

  1. If you use any parts or concepts from this library to any extent, please acknowledge the usage by citing the relevant publications of the ParaMonte library.
  2. If you regenerate any parts/ideas from this library in a programming environment other than those currently supported by this ParaMonte library (i.e., other than C, C++, Fortran, MATLAB, Python, R), please also ask the end users to cite this original ParaMonte library.

This software is available to the public under a highly permissive license.
Help us justify its continued development and maintenance by acknowledging its benefit to society, distributing it, and contributing to it.

Author:
Joshua Alexander Osborne, May 21 2024, 12:06 AM, University of Texas at Arlington
Fatemeh Bagheri, May 20 2024, 1:25 PM, NASA Goddard Space Flight Center (GSFC), Washington, D.C.
Amir Shahmoradi, May 16 2016, 9:03 AM, Oden Institute for Computational Engineering and Sciences (ICES), UT Austin